
Regarding the Latest Stampede Back into Tech Stocks

Jason recently highlighted the fact that investors are once again piling into tech stocks. The pull quote and chart appear below.
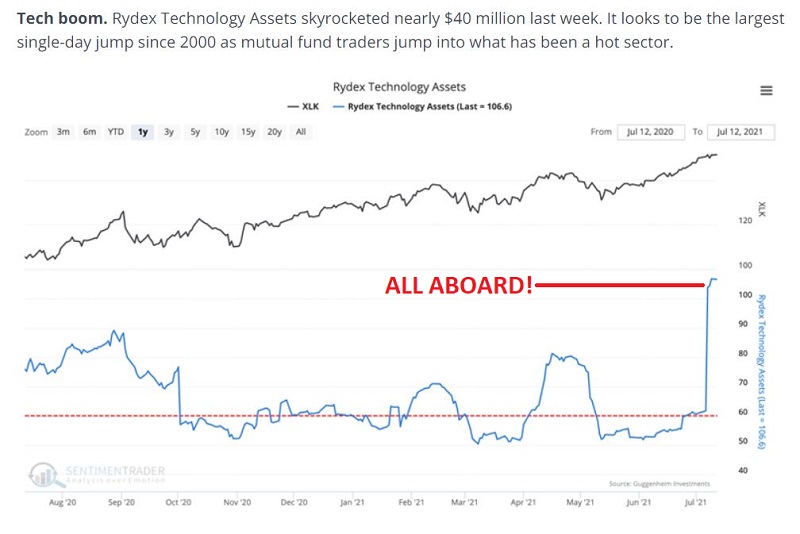
And why not? With Amazon, Apple, Nvidia, Google, and several other "biggies" roaring to new highs, it only seems reasonable to assert that the tech sector is BACK! Bigger, better, and hotter than ever!
Right? Well, maybe. Unfortunately, history may suggest otherwise.
TECH'S WEAKEST TIME OF YEAR
The chart below displays the Annual Seasonal Trend for ticker XLK (Technology Select Sector SPDR Fund),
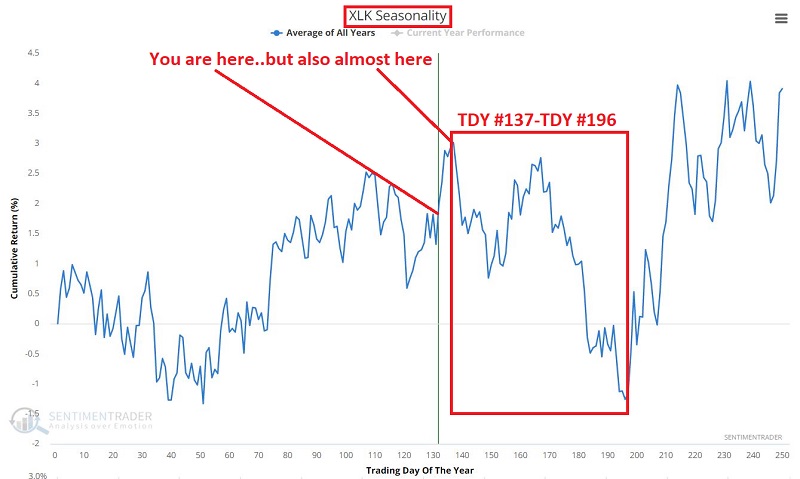
The key thing to note in this chart is that we are just a few trading days away from the beginning of the weakest time of year for tech stocks - a period that extends from the close on Trading Day of the Year #137 through the close on Trading Day of the Year #196.
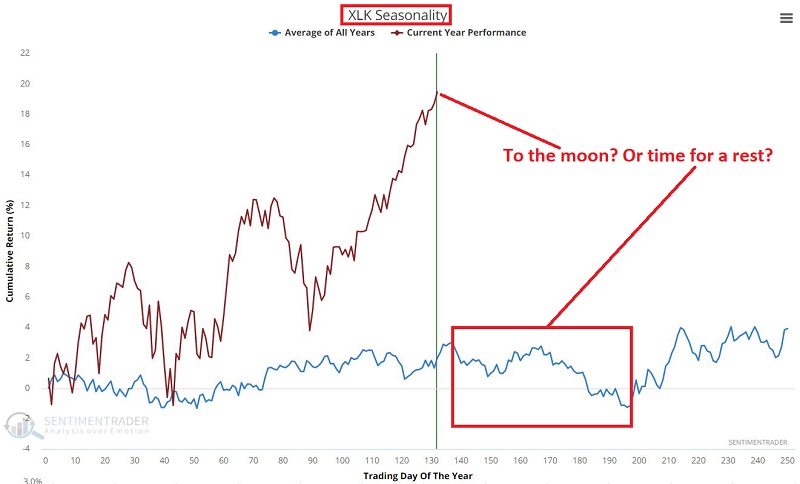
Is tech due for a "cooling off?" The chart below displays the same Annual Seasonal Trend as the chart above (blue line) but adds the performance of ticker XLK so far in 2021 (red line). You can draw your own conclusion.
So does all of this mean that tech stocks are doomed to weaken in the months ahead? Not at all. Still, before piling into tech along with the masses, let's consider the performance of the technology sector during the annual "Unfavorable" seasonal period directly ahead of us.
A CLOSER LOOK AT THE TECH "DANGER ZONE"
For testing purposes, we will use the S&P 500 Technology Index starting in 1953. This starting point was chosen because before 1953, the stock market was open for an abbreviated session on Saturdays (Shhh, don't give ‘em any ideas!), resulting in an additional 52 trading days a year. Since 1953 the market has averaged roughly 252 trading days per year.
The chart below displays the cumulative % growth of an investment held in the S&P 500 Technology Index ONLY:
- From the close on Trading Day of the Year (TDY) #137 through the close on TDY #196
- Every year since 1953
First, the Good News:
- This period has witnessed a gain 36 times (53% of the time) and a loss 32 times (47%)
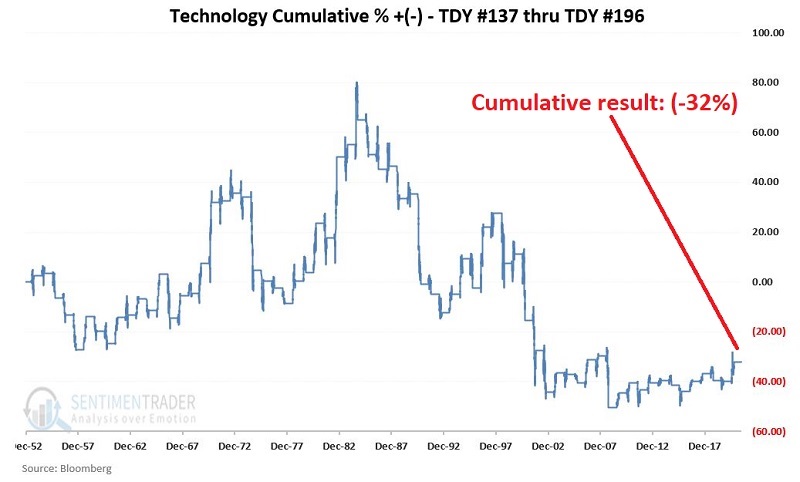
So technically, the "odds" slightly favor an advance. Still, the chart above gives investors a reason for pause. The real problem is that when tech is bad, it's awful. The chart below displays the year-by-year % + (-) for the technology sector during the Unfavorable seasonal period.
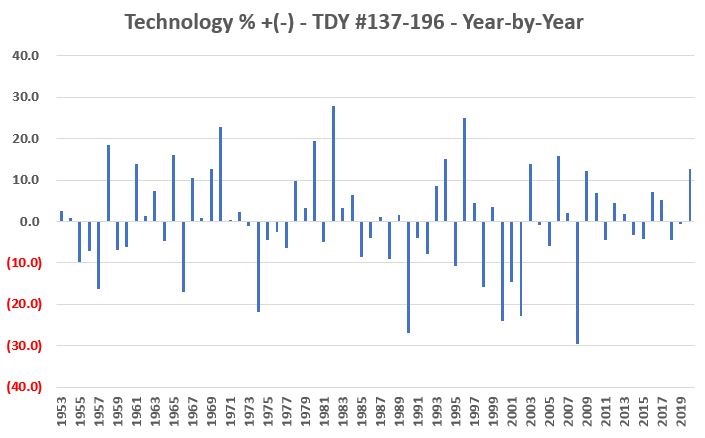
Key things to note:
- On a year-by-year basis, results are fairly random
- The average gain was +8.9%
- The average loss was -9.7%
- Since 2008 results have been up 7 years, down 5 years
To better appreciate the inferior nature of this Unfavorable period performance, consider the chart below, which displays:
- The cumulative % growth for the tech sector during all TDY NOT between 137 and 196
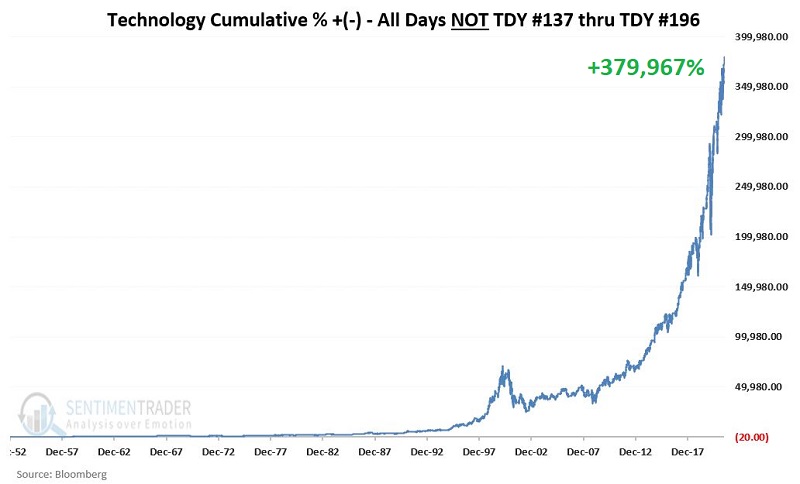
The cumulative gain from 12/31/1952 through 6/30/2021 is just under +380,000%.
ONE ADDITIONAL NOTE
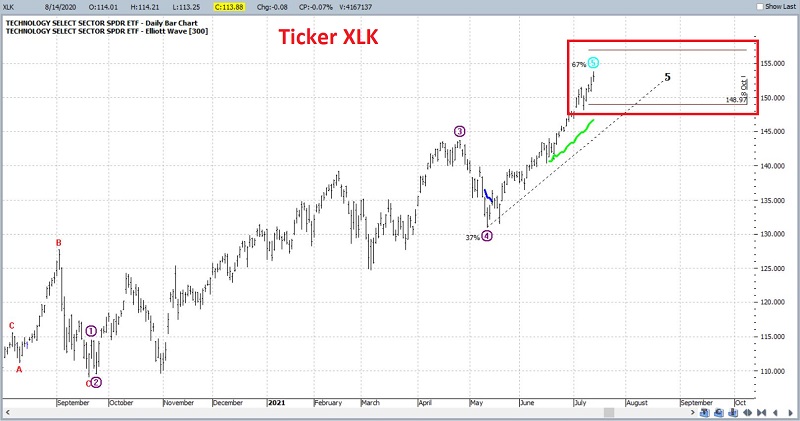
While I am not a true "Elliott Head" I often pay attention when Elliott Wave adds potentially confirming weight of the evidence in a given situation. For what it is worth, the EW algorithm built into ProfitSource is suggesting that ticker XLK may recently have fulfilled its projected upside potential, as shown in the chart below.
SUMMARY
Can the tech sector continue to run up in the months ahead? Are you kidding me? It's 2021 (I could probably stop right there), the Fed is still pumping, tech is still the "hot" sector, money is pouring into tech stocks at a record rate, and price is trending strongly higher.
There is every possibility that tech is once again another "runaway train." Still, from the close on 7/20/2021 through the close on 10/12/2021, investors may be wise to keep a close eye out for any signs of weakness in this key sector.
The majority of investors likely will not.