
Rebound pattern
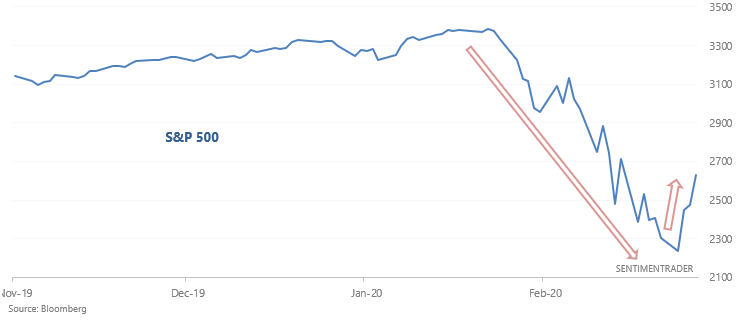
The S&P surged over the past 3 days after one of the most epic 5 week crashes in history. It's getting close to a standard 38.2%-50% retracement rally.
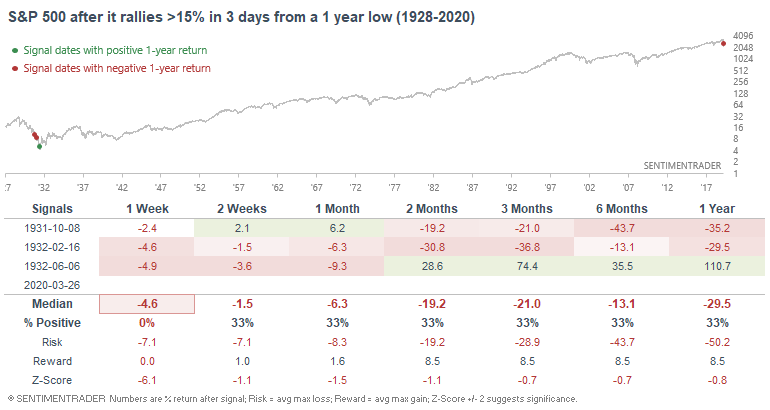
Such powerful 3 day rallies coming off of a 1 year low have only been seen during the 1929-1932 crash. The rally usually stalled over the next week, and since this was the Great Depression, returns over the next year weren't good.
What if we relax the parameters to increase sample sizes? The following table looks at historical cases in which the S&P rallied more than 10% over 3 days after hitting a 1 year low:
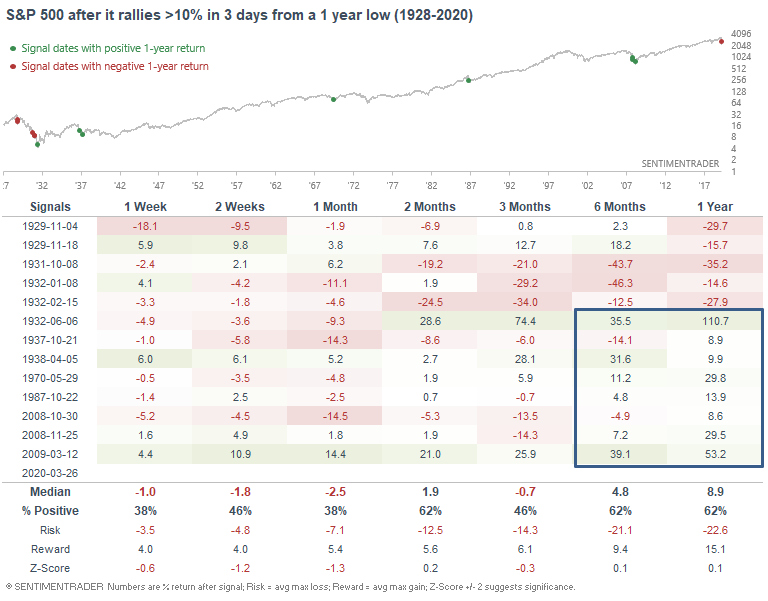
Once again, the S&P was choppy over the next few weeks. But aside from the 1929-1932 crash, this led to powerful rallies over the next 6-12 months. I'm not a big fan of price patterns, particularly since this market broke so many patterns on the way down. Moreover, the effectiveness of price patterns varies significantly from era to era and market to market.