
Rates, Bonds and The Really Big Picture

This is part 1 of a 3-part series on the long-term outlook for bonds. Part I illustrates the long-term history of interest rates. Part II details a simple way to stay on the right side of the trend in interest rates. Part III will discuss some possibilities for investing in a rising rate environment.
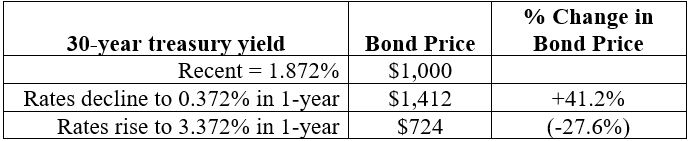
Recently, ticker TYX (an index that represents the annual yield on 30-yr. treasuries times x10) stood at 18.72. Here is what that implies:
- The current yield on a 30-year treasury is 1.872%
- Assume you buy today a newly issued 30-year treasury bond with a yield of 1.872%.
- You would pay $1,000 to buy the bond and twice a year for the next 30 years, the treasury will send you a check for $93.60, or $187.20 of interest per year.
- After 30 years the treasury will repay you the original $1,000.
This is what will happen if you buy and hold the bond for 30 years. Whether or not one thinks this is a good investment is in the eye of the beholder.
The question I want to address is "where will things stand a year from now?" Let's fast forward one year from now looking at two opposing scenarios using a bond price calculator.
Scenario #1: Interest rates decline 1.50 points to 0.372% over the next year
Under Scenario #1 after one year, you would be holding a 29-year bond at a price of roughly $1,412. If rates were to plummet to 0.372% a bond paying 1.872% would suddenly look pretty valuable, hence the price would rise substantially. But remember that this rise in price in price is only temporary. Over the course of the next 29 years, one way or another that bond is going to decline in value back down to $1,000 at maturity.
So, do you sell and take a 40%+ gain – but then have to figure out where to invest the proceeds? Or do you hold on and watch the value of the bond decline over the years ahead?
Scenario #2: Interest rates rise 1.50 points to 3.372% over the next year
Under Scenario #2 you would be holding a 29-year bond at a price of roughly $724. If rates rise to 3.372% the only way someone will pay to buy your bond paying only 1.872% is if you sell it to them at a discount.
So, do you simply hold the bond paying an inferior rate of interest and wait for it to work its way back up to $1,000 by maturity 29 years hence? Or do you sell it, take a loss of capital of roughly -28% and reinvest the proceeds at the higher current rate of interest?
These are decisions investors must make individually. But the point here is simply to illustrate the significant implications of changes in interest rates, particularly on long-term bonds.
For anyone who has been in the markets for roughly the past 40 years, the only thing they've known is a long-term declining trend in interest rates.
This will not last forever, so it behooves investors to begin to envision an entirely different investment landscape. If you started investing anytime after 1980 then the only environment you know is one where rates are falling. Any trading method or system that looked good based in part on the rising bond prices – particularly any strategy that has a heavy focus on long-term treasuries – WILL NOT be the same animal if and when interest rates ultimately embark on a sustained multi-year (decade?) advance. Now is the time to begin to prepare for that eventuality, even if only in your mind and not necessarily your investment accounts for now.
At this point the conventional wisdom seems to go something like this:
- The Fed will do everything it can to keep rates low for the foreseeable future
- Interest rates have gone negative in other countries, so it is possible that it could happen in the US
- Most people believe interest rates are more likely to rise than to fall (much of this opinion is based on expectations of higher inflation due to the trillions of dollars being printed by the Fed)
How will things actually play out? That is anyone's guess. However, as we saw in the example scenarios above, the trend of interest rates can have significant implications for investors seeking income and yield. So, let's step back and take a look at "the bigger picture."
The chart below is courtesy of Tom McClellan, editor of The McClellan Oscillator and displays bond yields going back roughly 250 years. As you can see in the chart, historically interest rates have tended to move in 60-year waves, 30 years up followed by 30 years down. This is not an exact cycle, but has been a pretty consistent guide for several centuries.
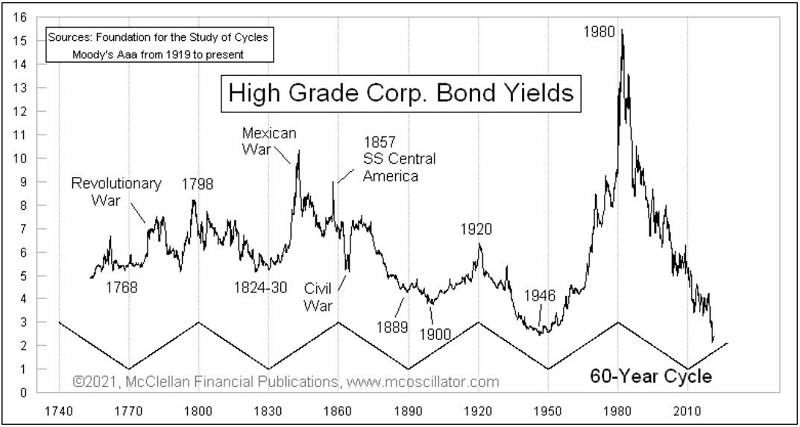
Interest rates peaked near 15% in the early 1980's and have been trending lower ever since. In essence, one could argue that the reversal in rates is now roughly 10 years overdue. This chart – along with justifiable concerns about the inflationary potential of rampant money printing – suggests that investors should in fact be paying close attention for a reversal in interest rates to a long-term uptrend.
But how will we know when that time has come? Well, like most things in the markets, likely only with hindsight. However, because interest rates tend to move in such long-drawn-out waves, it is not necessary to "pick a top or bottom" in rates. The key is to latch onto the major trend – up or down – and ride it for a long, long time.
But how can we track the trend in interest rates? Let's look at one simple approach. For this we will apply a 120-month exponential moving average to ticker TYX (or $TYX with some data vendors). In essence, we are looking at roughly a 10-year moving average. For the record, TYX equates to the annual yield on a 30-year treasury bond x 10. So, a yield of 1.872% results in a TYX reading of 18.72. The chart below is a monthly chart of TYX with the 120-month EMA overlaid.
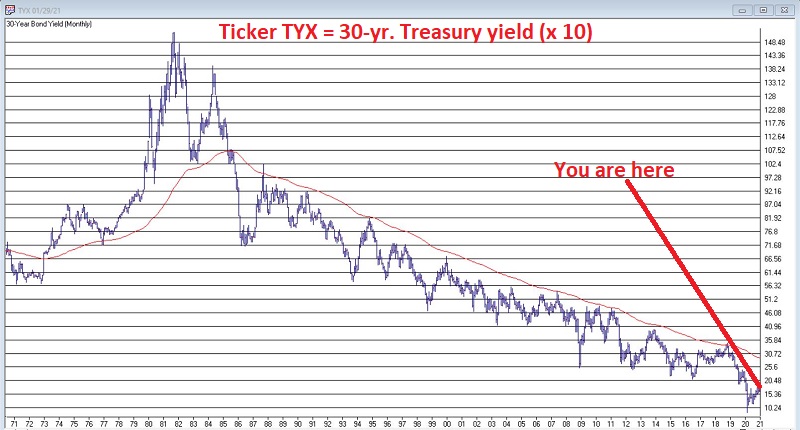 (Chart courtesy of AIQ TradingExpert)
You can see on the far left that this simple method picked up on a rising rate environment in the early 1970's when TYX broke above the EMA. Rates rose for over 8 years before peaking above 15% in late 1981. Rates began to decline from there and finally broke below the EMA in mid-1985. Except for a few brief blips above the 120-EMA in 1987 and 2018, the trend has been down, down, down.
Two things to note:
- This method will obviously never catch a bottom or top in interest rates
- Like any moving average based trend-following method this one is not immune to whipsaw
These two caveats mean that:
- There is risk of loss in bonds from the time interest rates ultimately bottom out and the time they finally break above the 120-EMA
- It is possible that rates might move above the 120-EMA (triggering mass "rates are in an uptrend" pronouncements) and then reverse back to the downside, at least temporarily.
Still, remember that we are looking at this method as an overarching guide to the long-term trend and NOT as a "market timing tool" per se. Look for more on this simple tool in Part II.