Data &
Technology
Research
Reports
Report Solutions
Reports Library
Actionable
Strategies
Free
Resources
Simple Backtest Calculator
Simple Seasonality Calculator
The Kelly Criterion Calculator
Sentiment Geo Map
Public Research Reports
Free Webinar
Pricing
Company
About
Meet Our Team
In the News
Testimonials
Client Success Stories
Contact
Log inLoginSign up
< BACK TO ALL REPORTS

Rally path given how sectors are reacting

Jason Goepfert
2020-05-01
The price path since stocks bottomed on March 23 is still correlated most highly with major bottoms, as opposed to bear market rallies. The same goes for how sectors have performed during the rally. It's not a huge edge but does suggest a medium-term digestion period.

One of the more popular ways to look at the rebound over the past month is how much it looks like other rallies. Does it seem more like a bull market kick-off, or just another bear market rally?

We've looked at it multiple ways since March, and the Wall Street Journal noted it again on Friday.

"In zoological terms, is the 34% rebound since the low of March 23 the start of a new bull market or merely a dead cat bounce we will all forget when the bear returns?"

The idea that we're going to enjoy a v-shaped recovery is being met with increased skepticism as the latest studies suggest a more prolonged misery than many have been expecting. So, let's revisit it in a couple of different ways. First, looking at the highest-correlated rebounds using pure price action, then according to which sectors have led and lagged.

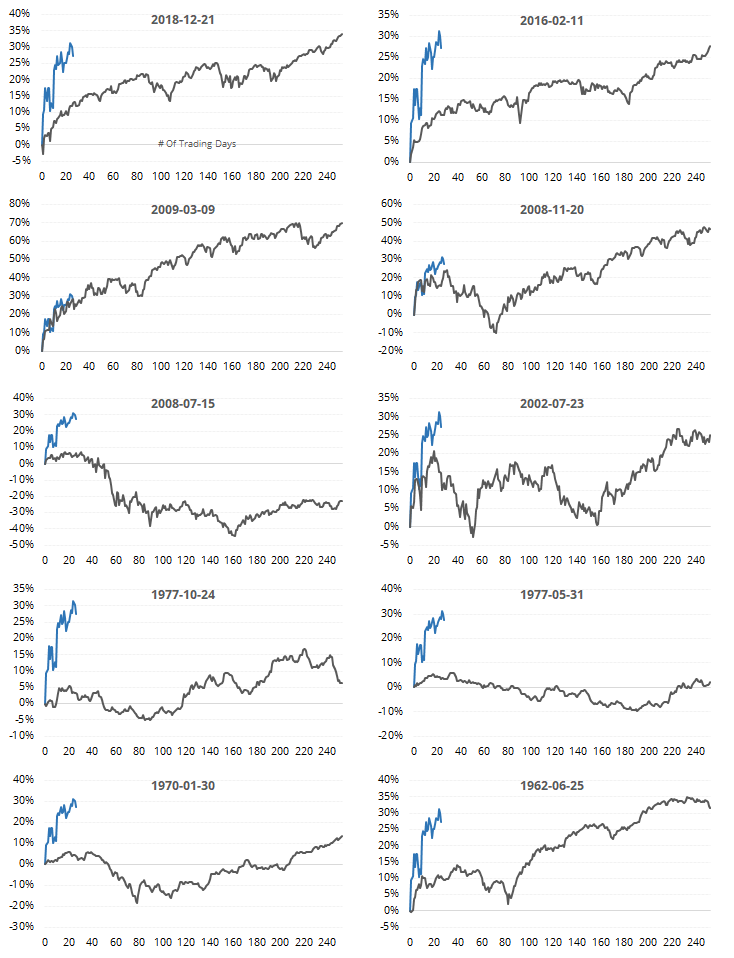
Using pure price action this many days into a rebound following a 52-week low, here is the price path among the 10 highest-correlated bounces.

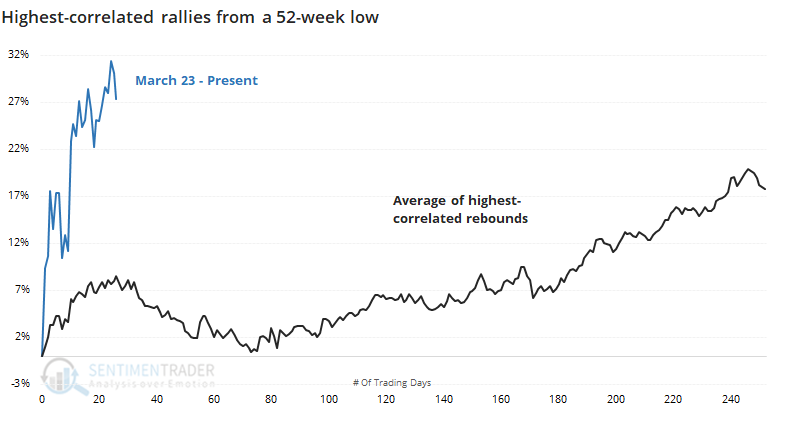
Most of them ran into some trouble, to put it mildly, right around now.

As the WSJ also noted:

"Furthermore, it has been a strange recovery. After energy stocks, the two best sectors in the S&P from the March low up to Friday were health care and utilities, defensive companies usually expected to prosper in bad times, not in a bounce back. Industrials, classic cyclical stocks that ought to do well when investors expect the economy to prosper, underperformed."

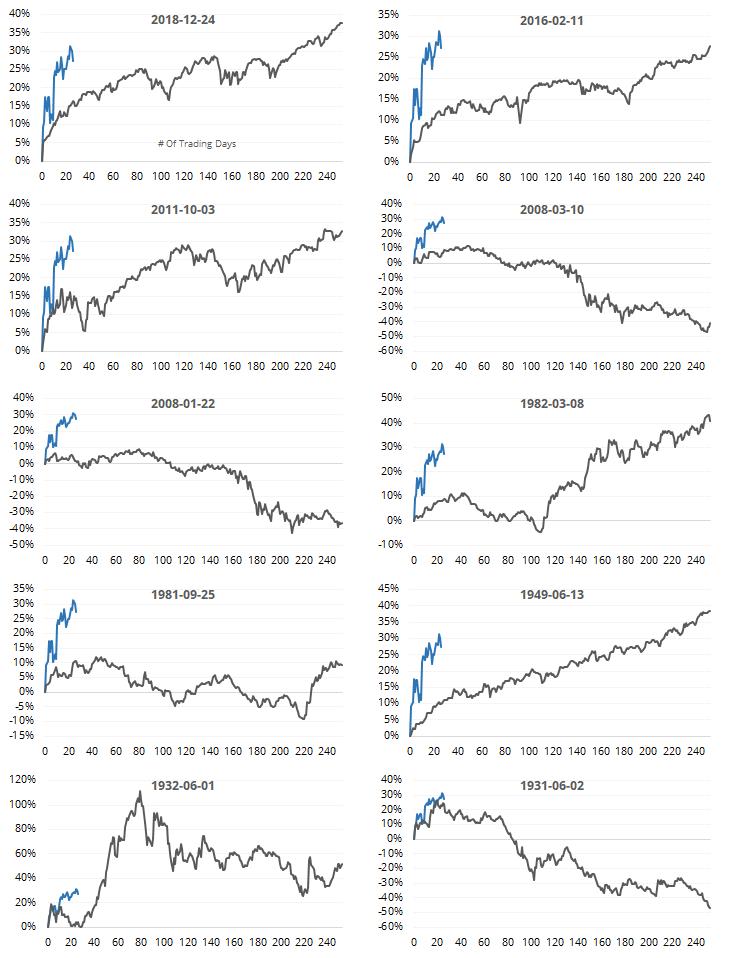
Instead of looking at action in the S&P 500 index itself, let's focus on performance among the 11 major sectors during the rally. Again, we'll look at the price path in the S&P following the rebounds with the sector returns that are most closely correlated to how sectors performed since the March 23 bottom.

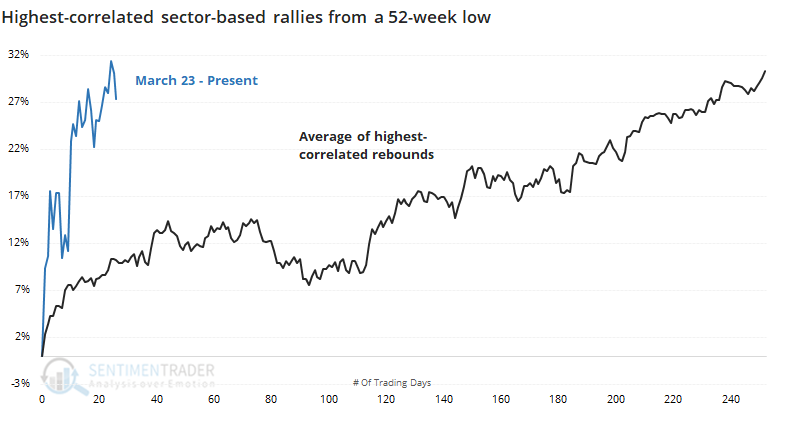
Again, the S&P tended to plateau around now, at least for a few months, though the pullbacks weren't as deep. Individually, there was wide variation in their paths going forward.

We often like to look also at counter-examples. If the highest-correlated ones show a certain pattern, and the least-correlated show the opposite pattern going forward, then it adds to the robustness of the study.

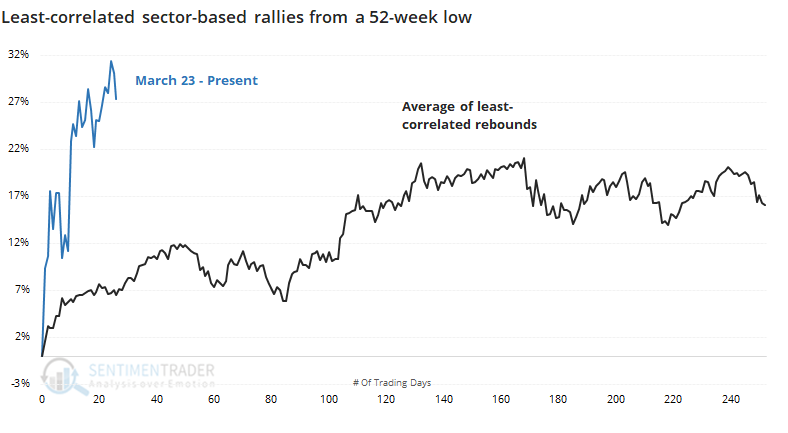
After rallies with the highest-correlated sector returns, the future path of the S&P vacillated from about now through approximately day 90, then took off again to the upside.

After rallies with the least-correlated sector returns, the digestion period tended to be shorter, but the ensuing longer-term rallies were weaker.

Between price action itself and the sectors that have been driving the rally, the probability continues to look more like a legitimate bull market beginning rather than just a bear market rally. It's not a slam dunk, though, and if this is the latter, then upside should be extremely limited from here on out. If we continue to see higher highs at some point, then the "bear market rally" idea loses almost any credibility.

Sorry, you don't have access to this report

Upgrade your subscription plan to get access
Go to Dasboard
DATA &
TECHnologies
IndicatorEdge
‍
BackTestEdge
‍
Other Tools
‍
DataEdge API
RESEARCH
reports
Research Solution
‍
Reports Library
‍
actionable
Strategies
Trading Strategies
‍
Smart Stock Scanner
‍
FREE
RESOUrCES
Simple Backtest
Calculator
Simple Seasonality
Calculator
The Kelly Criterion
Calculator
Sentiment Geo Map
‍
Public Research Reports
‍
Free Webinar
COMPANY
‍
About
‍
Meet our Team
‍
In the News
‍
Testimonials
‍
Client Success Stories
Pricing
Bundle pricing
‍
Announcements
‍
FAQ
© 2024 Sundial Capital Research Inc. All rights reserved.
Setsail Marketing
TermsPrivacyAffiliate Program
Risk Disclosure: Futures and forex trading contains substantial risk and is not for every investor. An investor could potentially lose all or more than the initial investment. Risk capital is money that can be lost without jeopardizing ones’ financial security or life style. Only risk capital should be used for trading and only those with sufficient risk capital should consider trading. Past performance is not necessarily indicative of future results.

Hypothetical Performance Disclosure: Hypothetical performance results have many inherent limitations, some of which are described below. No representation is being made that any account will or is likely to achieve profits or losses similar to those shown; in fact, there are frequently sharp differences between hypothetical performance results and the actual results subsequently achieved by any particular trading program. One of the limitations of hypothetical performance results is that they are generally prepared with the benefit of hindsight. In addition, hypothetical trading does not involve financial risk, and no hypothetical trading record can completely account for the impact of financial risk of actual trading. for example, the ability to withstand losses or to adhere to a particular trading program in spite of trading losses are material points which can also adversely affect actual trading results. There are numerous other factors related to the markets in general or to the implementation of any specific trading program which cannot be fully accounted for in the preparation of hypothetical performance results and all which can adversely affect trading results.

Testimonial Disclosure: Testimonials appearing on this website may not be representative of other clients or customers and is not a guarantee of future performance or success.