Data &
Technology
Research
Reports
Report Solutions
Reports Library
Actionable
Strategies
Free
Resources
Simple Backtest Calculator
Simple Seasonality Calculator
The Kelly Criterion Calculator
Sentiment Geo Map
Public Research Reports
Free Webinar
Pricing
Company
About
Meet Our Team
In the News
Testimonials
Client Success Stories
Contact
Log inLoginSign up
< BACK TO ALL REPORTS

Prices are surging and Wall Street can't keep up

Jason Goepfert
2020-06-10
Share prices are surging, and Wall Street can't keep up. The S&P 500 is now nearly 10% above where strategists think it should end the year, the widest spread in more than 20 years. Analysts have been rushing to upgrade price targets, but even that hasn't been enough to keep up with gains in Apple, the largest stock in the market.

In June 2019, the S&P 500 had rallied enough to already meet Wall Street strategists' year-end target. Even by late 2019, they were not very optimistic about the S&P 500's prospects for 2020. That's usually been a good sign over the medium-term. 

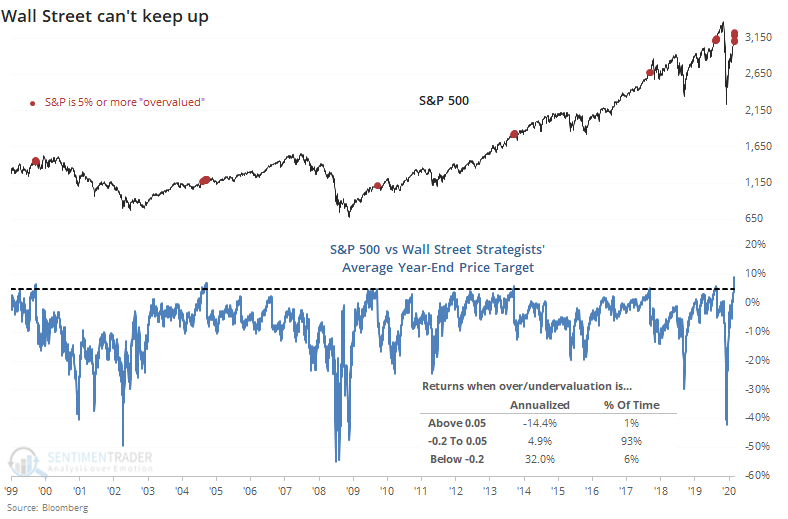
We've seen in prior years that when the S&P becomes 20% or more "undervalued" according to strategists, it's been a very good sign. It was again this year though it doubled that discount before rebounding. Now, strategists are not really buying into the rally. In aggregate, they haven't been raising their year-end price target for the S&P 500 nearly fast enough to keep up with the index.

The S&P is now nearly 10% higher than the average strategist year-end target, the highest since at least 1999, as noted by Bloomberg.

We can see from the chart that the S&P 500's annualized return after becoming at least 5% overvalued relative to strategists' expectations is a terrible -14.4%, versus +32.0% when it's 20% or more undervalued.

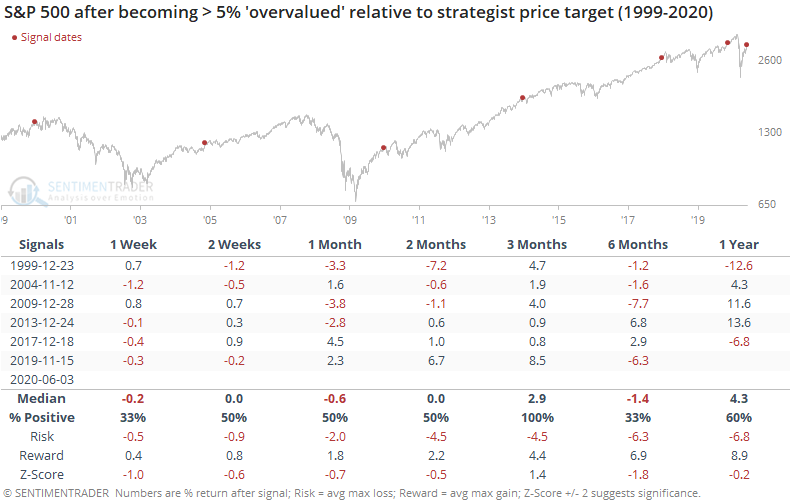
When the S&P first runs more than 5% ahead of strategists' estimates, returns over the next six months were questionable.

Strategists tend to work from the top down, utilizing macro inputs to gauge the likelihood of higher or lower prices. Analysts tend to work from the bottom up, evaluating earnings prospects for individual companies. After a historic panic in March, they've been busy upgrading the price targets on stocks they follow.

Their optimism has generally not been rewarded.

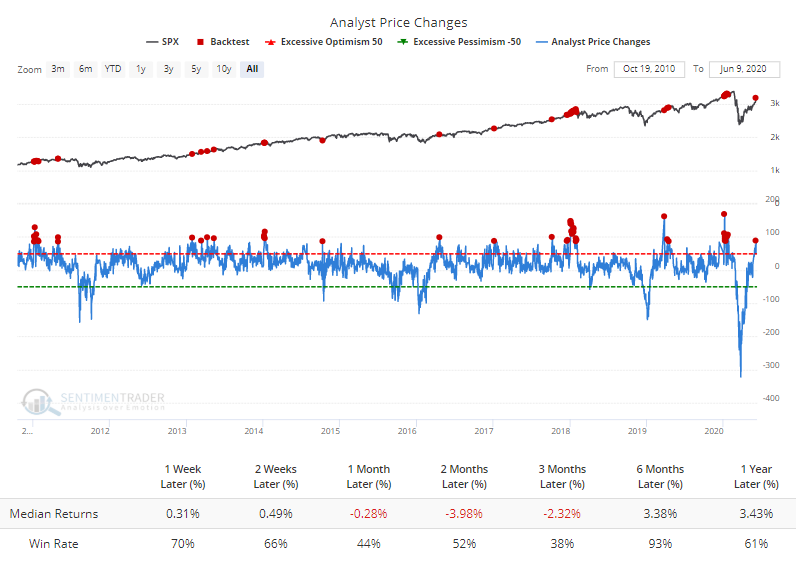
The Backtest Engine shows that when analysts upgraded their price targets on more than a net 85 stocks within the S&P 500, returns in the index over the next three months were poor and consistently negative.

Curiously, they remain tepid on prospects for the largest stock in the U.S. The share price of Apple has run far ahead of where analysts think it should be, indicating that the stock is nearly 10% overvalued.

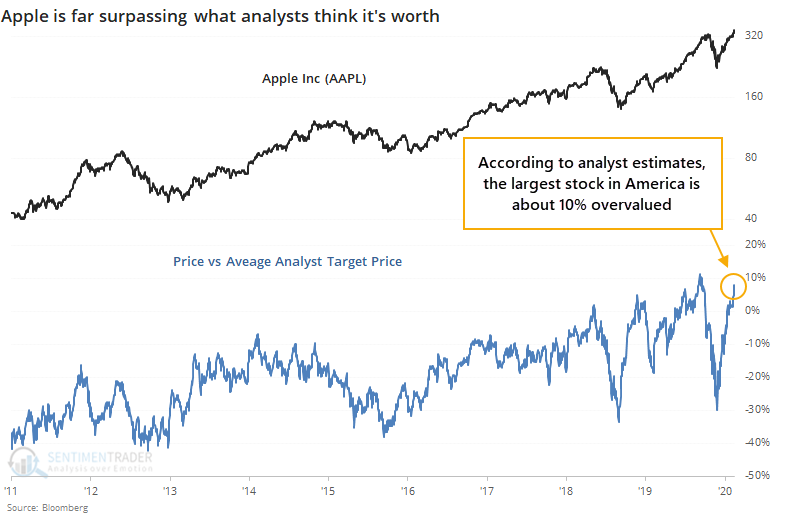
While this has not been a precise timing signal, when the stock has run this far ahead of analysts, its future returns were mediocre, with short-term gains usually given back during subsequent pullbacks.

There are quite a few conflicting cross-currents right now, with (mostly) shorter-term signs of speculation and rates of change suggesting a period of short- to medium-term digestion at least. This sudden price surge, over and above fundamental expectations, is another shorter-term warning sign. Longer-term, we continue to see massive thrusts and recoveries in stocks, which have led to higher prices 6-12 months later almost without fail.

Sorry, you don't have access to this report

Upgrade your subscription plan to get access
Go to Dasboard
DATA &
TECHnologies
IndicatorEdge
‍
BackTestEdge
‍
Other Tools
‍
DataEdge API
RESEARCH
reports
Research Solution
‍
Reports Library
‍
actionable
Strategies
Trading Strategies
‍
Smart Stock Scanner
‍
FREE
RESOUrCES
Simple Backtest
Calculator
Simple Seasonality
Calculator
The Kelly Criterion
Calculator
Sentiment Geo Map
‍
Public Research Reports
‍
Free Webinar
COMPANY
‍
About
‍
Meet our Team
‍
In the News
‍
Testimonials
‍
Client Success Stories
Pricing
Bundle pricing
‍
Announcements
‍
FAQ
© 2024 Sundial Capital Research Inc. All rights reserved.
Setsail Marketing
TermsPrivacyAffiliate Program
Risk Disclosure: Futures and forex trading contains substantial risk and is not for every investor. An investor could potentially lose all or more than the initial investment. Risk capital is money that can be lost without jeopardizing ones’ financial security or life style. Only risk capital should be used for trading and only those with sufficient risk capital should consider trading. Past performance is not necessarily indicative of future results.

Hypothetical Performance Disclosure: Hypothetical performance results have many inherent limitations, some of which are described below. No representation is being made that any account will or is likely to achieve profits or losses similar to those shown; in fact, there are frequently sharp differences between hypothetical performance results and the actual results subsequently achieved by any particular trading program. One of the limitations of hypothetical performance results is that they are generally prepared with the benefit of hindsight. In addition, hypothetical trading does not involve financial risk, and no hypothetical trading record can completely account for the impact of financial risk of actual trading. for example, the ability to withstand losses or to adhere to a particular trading program in spite of trading losses are material points which can also adversely affect actual trading results. There are numerous other factors related to the markets in general or to the implementation of any specific trading program which cannot be fully accounted for in the preparation of hypothetical performance results and all which can adversely affect trading results.

Testimonial Disclosure: Testimonials appearing on this website may not be representative of other clients or customers and is not a guarantee of future performance or success.