
Pre-election years and stock market performance

Key points
- Pre-election years have tended to show early market strength
- February, during pre-election years, has performed much better than average
- Pre-election year strength often extends through at least July
February of non-pre-election years
Before we look at February S&P 500 performance during pre-election years, let's first establish a baseline. To do so, we will look first at February performance for all other years (i.e., post-election, mid-term, and election years).
The chart below displays the growth of $1 invested in the S&P 500 ONLY during the month of February of non-pre-election years. The table below summarizes performance.
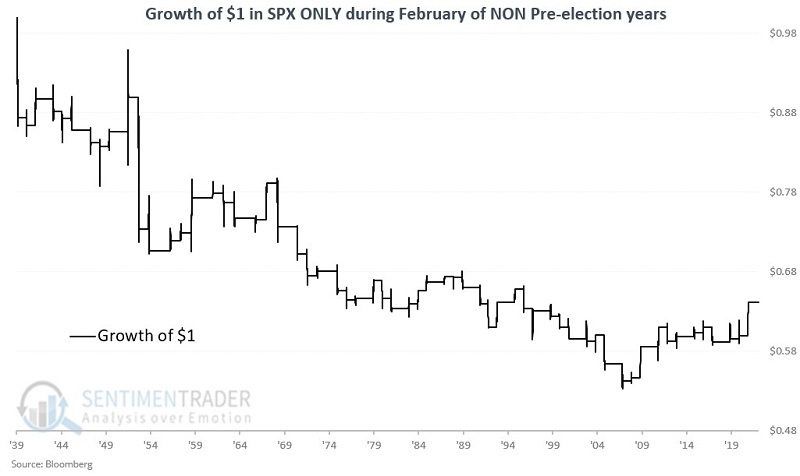
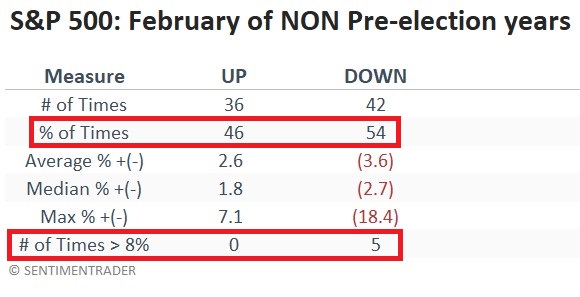
Overall results have been subpar. Now, in contrast, let's focus solely on stock market performance only during the month of February during pre-election years.
February of pre-election years
The chart below displays the growth of $1 invested in the S&P 500 ONLY during the month of February of pre-election years. The table below summarizes performance.
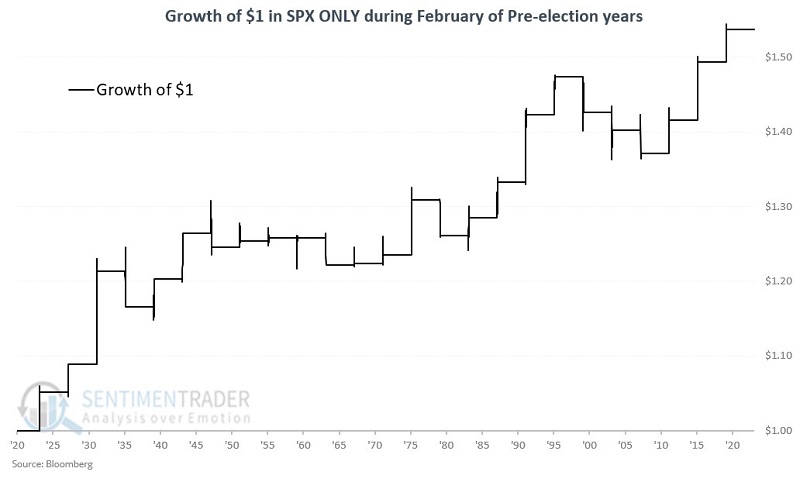
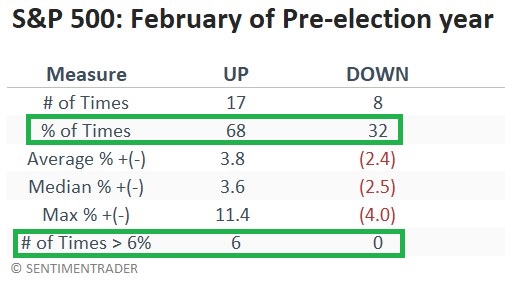
The overall results may not be overwhelming, but they are far better than the average February, and suggest giving the bullish case the benefit of the doubt. Note also that outsized returns went from being all unfavorable to all favorable. This suggests that if the market is going to make a big move in February 2023 it will likely be to the upside.
Extending the favorable period through April
Now let's look at a three-month timeframe. The chart below displays the growth of $1 invested in the S&P 500 ONLY during the months of February through April of pre-election years. The table below summarizes performance.
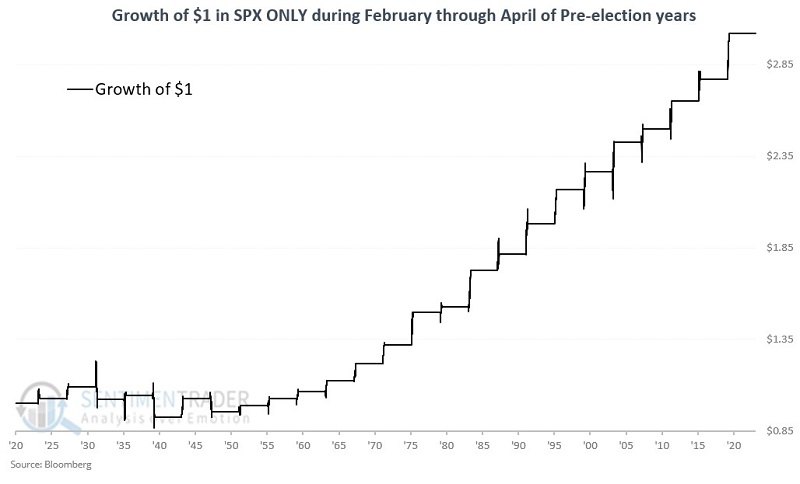
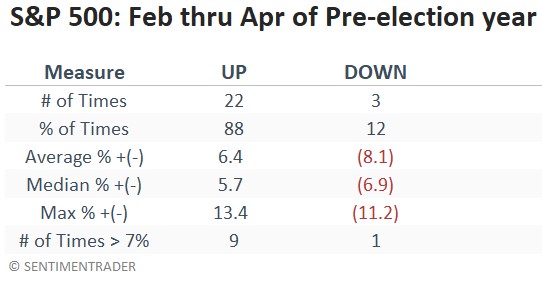
These results favor short-term traders extending their horizons beyond just the month of February.
Extending the favorable period through July
The chart below displays the growth of $1 invested in the S&P 500 ONLY during the months of February through July of the pre-election years. The table below summarizes performance.
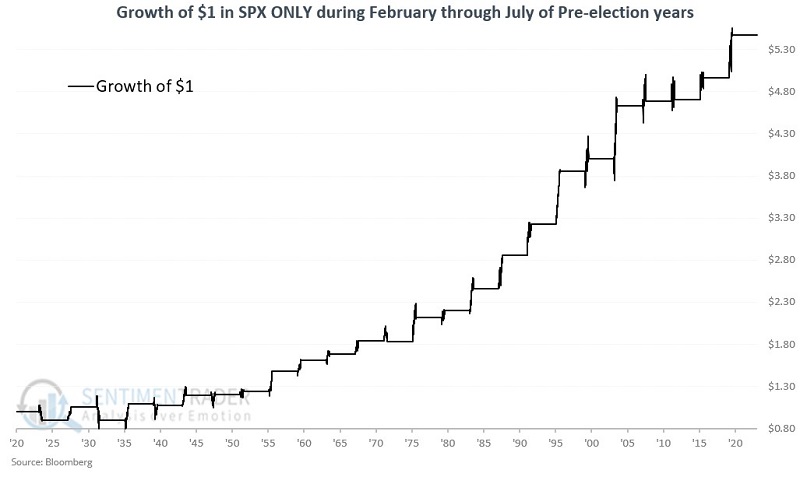
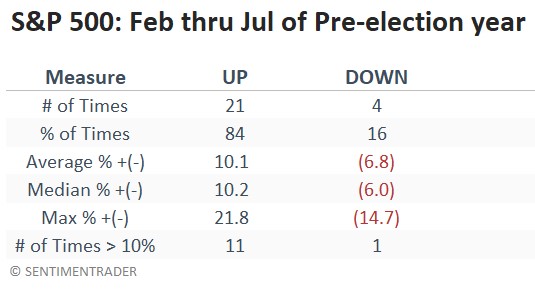
These results favor giving the bullish case the benefit of the doubt as long as price action holds up.
Narrowing to the post-Depression years
The 1930s were awful overall for stocks as the Great Depression (and notably deflation) unfolded and cratered stocks. More than a handful of pundits are presently arguing that another round of deflation is around the corner, so it is helpful to consider the entire history, including the 1930s. Nevertheless, the market has been a different animal since the start of the 1940s.
The chart below displays the growth of $1 invested in the S&P 500 ONLY during the months of February through July of the pre-election years starting in 1942. The table below summarizes performance.
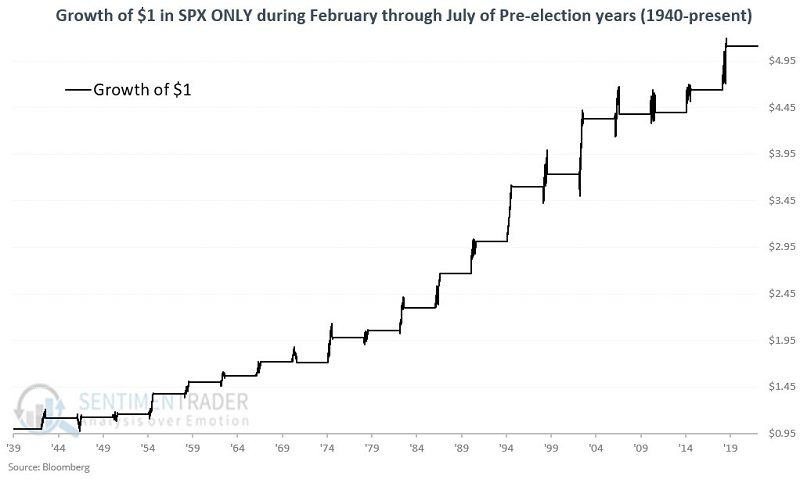
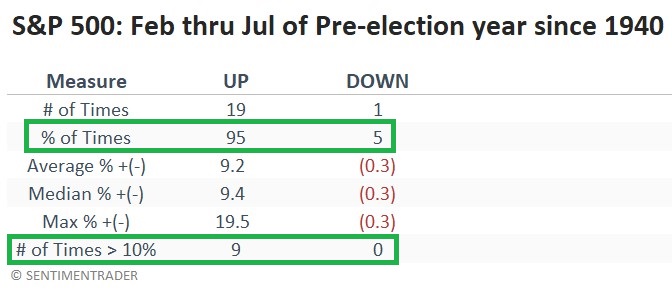
The only period that showed a loss was 1971, with an end of January through the end of July decline of a modest -0.3%.
What the research tells us…
As always, seasonal trends do not tell you what will happen, only what has happened in the past. Nevertheless, a favorable seasonal trend can help guide investors to potentially better-than-average opportunities. When seasonality and price align, good things often happen. With several major indexes attempting to establish price uptrends, the market may surprise investors weary from the steady decline of 2022.