
PPI inflation and the stock market - Part II

Key points
- The Producer Price Index is an important - and often leading - gauge of inflation
- There are a variety of useful ways to interpret PPI inflation, as covered in Part I
- This piece combines the indicators discussed in Part I into one comprehensive model
Review of PPI Indicators #1 through #3
In Part I, I highlighted three indicators based on the Producer Price Index. To quickly recap:
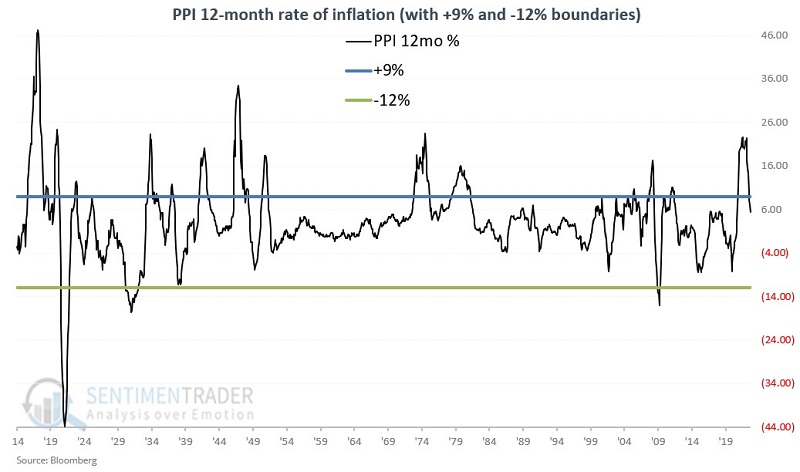
Indicator #1: Looks at the 12-month percentage change in PPI. Below +9% and above -12% is bullish, outside of that range in bearish.
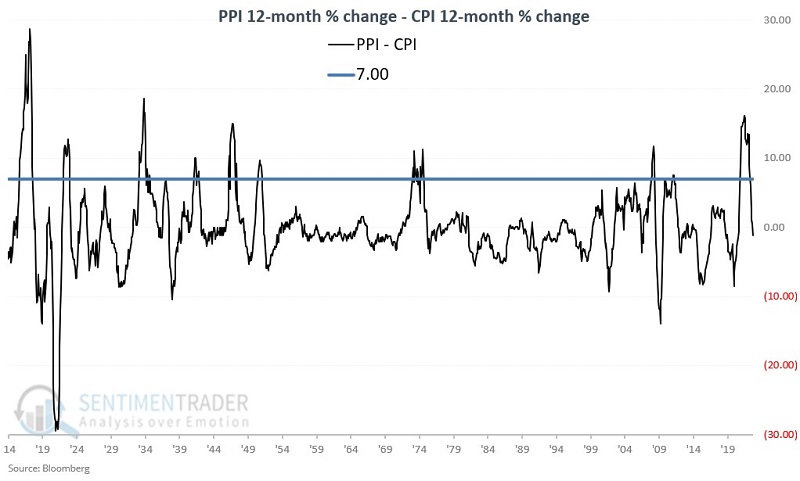
Indicator #2: Is calculated as the Producer Price Index 12-month percentage change minus the Consumer Price Index (CPI) 12-month percentage change. Below +7.00 is bullish; above that is bearish.
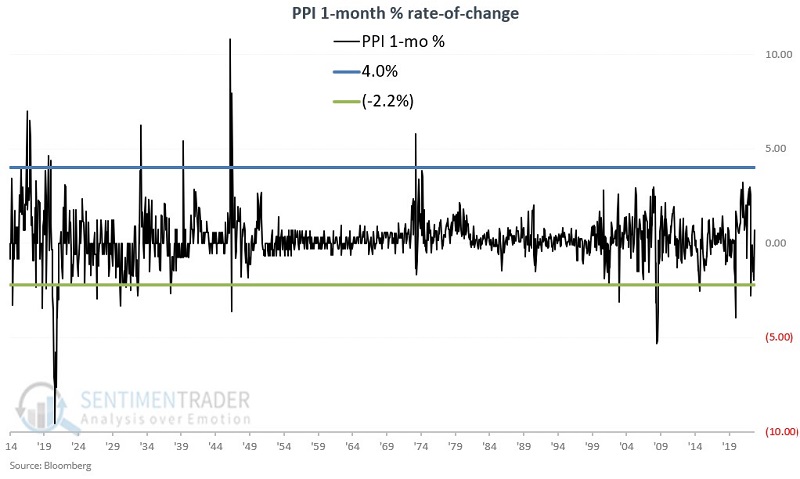
Indicator #3: Looks at the 1-month percentage change in the PPI. Between +4% and -2.2% is bullish. Outside of that range is bearish.
Now let's put the three together into one model.
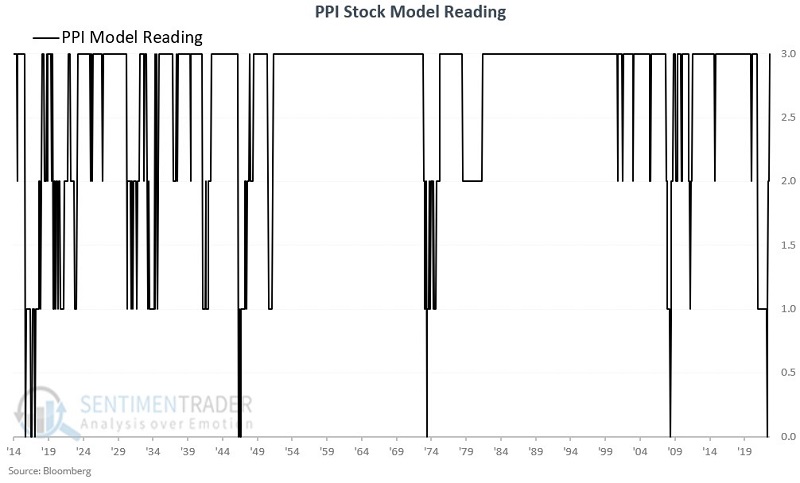
PPI Stock Market Model
This model considers the state of all three PPI indicators at the end of each month. If a given indicator is bullish at the end of a month, that adds one point to the model. As such, at the end of any month, the model can read +3, +2, +1, or 0.
The chart below displays the month-end status of this model since 1914.
Now let's look at how these readings relate to stock market performance.
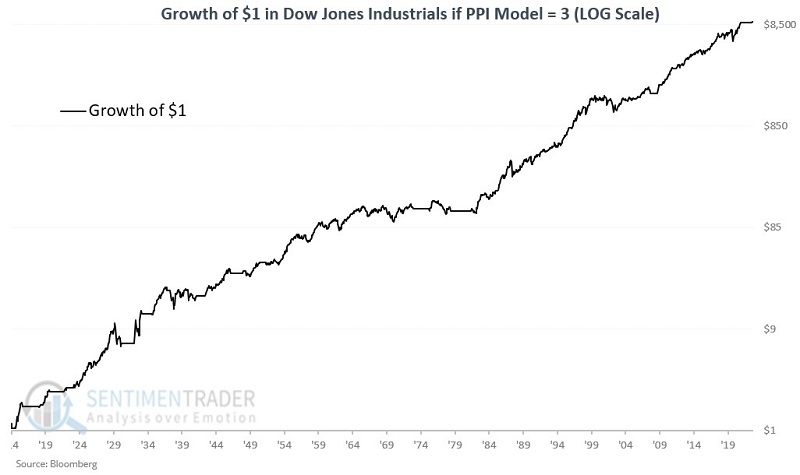
PPI Model Readings = +3
The logarithmic chart below displays the growth of $1 in the Dow Jones Industrials since 1914 if held only when the PPI Model = +3 (i.e., if all three PPI indicators were rated as bullish at the end of the previous month). The cumulative gain is +908,379%.
PPI Model Readings = +2, +1 or 0
The chart below displays the growth of $1 in the Dow Jones Industrials separately since 1914 if the PPI Model reads +2, +1, or 0.
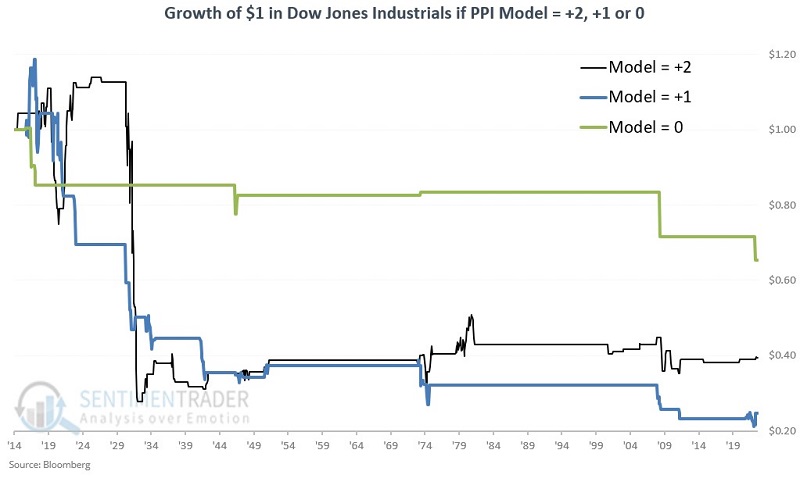
As you can see, the results were uniformly unfavorable over time.
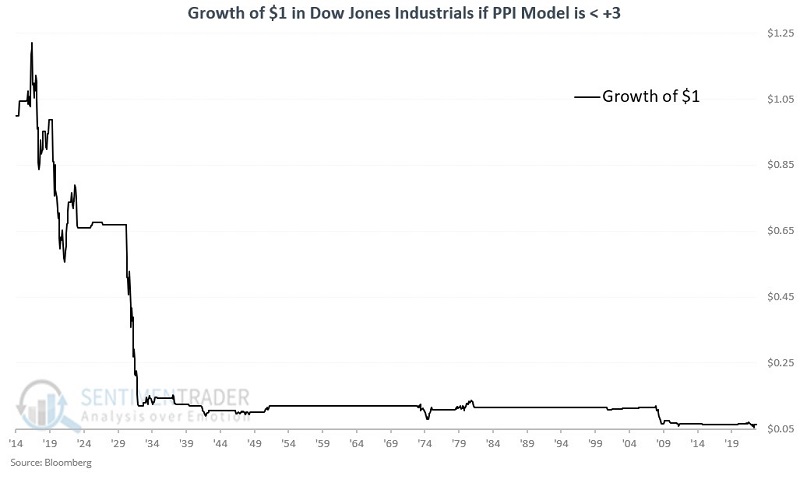
PPI Model Readings < +3
The chart below displays the growth of $1 in the Dow Jones Industrials since 1914 if the PPI Model reads anything less than +3. The cumulative result is a loss of -94%.
Summary of performance
The table below shows Dow performance during favorable (+3 readings) periods and unfavorable (< +3 readings) periods.
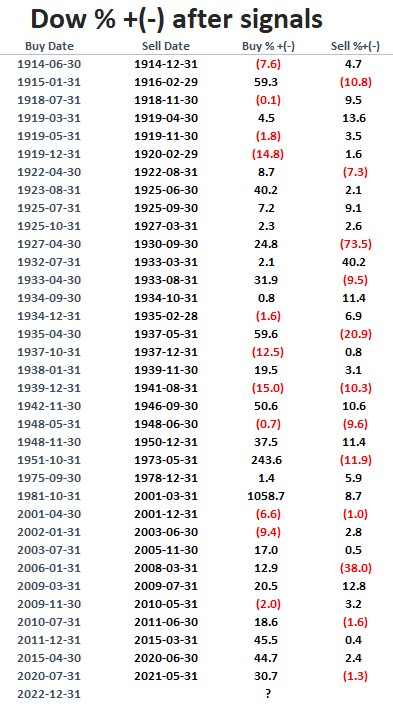
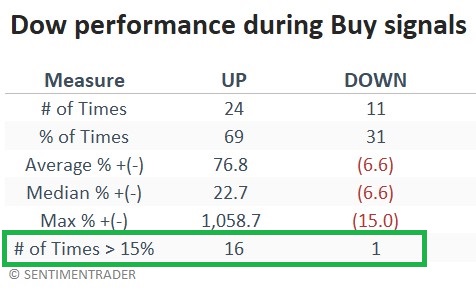
The table below summarizes Dow performance during buy signals.
The table below summarizes Dow performance during sell signals.
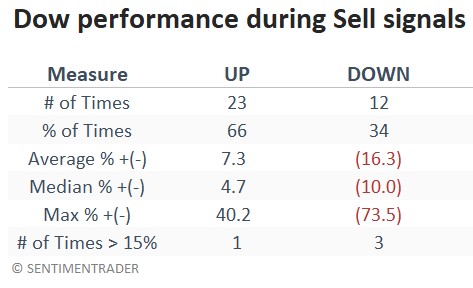
It is important to note that the Dow showed a gain 66% of the time during sell signals. So a sell signal from this model is not a "death sentence" for the stock market. That said, several significant bear market declines occurred while the model was bearish.
Another note: The devastating decline during the early 1930s accounted for much of the decline during sell signals. So let's look at post-1932 sell signals to assess their usefulness.
The chart below displays the growth of $1 in the Dow Jones Industrials since July 1932, when the PPI Model reads anything less than +3.
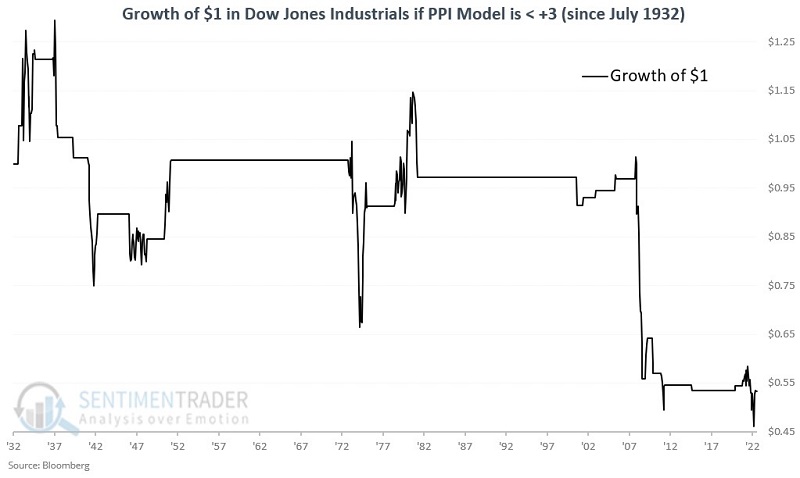
While there are points in the chart above where the stock market rallied, the bottom line is that extremes in PPI readings did an excellent job of warning investors before several severe stock market declines. Likewise, the cumulative growth during sell signals since 1932 is a loss of -47%.
Where the model currently stands
The PPI Stock Market Model was unfavorable from 2021-05-31 through 2022-12-31, at which point it turned favorable once again. As of 2023-02-21, all three PPI indicators are rated favorable. So the combined PPI Model is reading +3 and is considered favorable for stocks.
Let's take a closer look at the current status of each indicator.
Indicator #1: In the chart below, we see that 12-month PPI inflation dropped back below +9% as of 2022-12-31 and presently stands at 5.46%. Since the latest reading is between +9% and -12%, this indicator is rated as favorable.
Indicator #2: In the chart below, we see that PPI inflation minus CPI inflation fell back below +7.00 as of 2022-10-31 and presently stands at -1.14. Since the last reading is below +7.00, this indicator is rated as favorable.
Indicator #3: In the chart below, the latest 1-month percentage change in the PPI was +0.71%. Since this reading is between +4% and -2.2%, this indicator is rated as favorable.
What the research tells us…
It is not news to most investors that inflation is an essential factor that can impact the stock market significantly. However, quantifying the current state of inflation related to stock market performance is another matter. Many investors rely on headlines and news to determine what they should think - or in many cases, how they "feel" - about inflation. A more sound approach is to analyze historical stock market performance relative to the status of reliable inflation indicators and use that as a guide going forward. The current favorable status of the PPI Stock Market Model detailed here does not guarantee higher stock prices. But it does suggest that the current level of fear-mongering surrounding the state of inflation is - at least for the moment - overdone. Suppose inflation is to pick up shortly. In that case, one or more of the three model indicators will likely quickly detect the new unfavorable trend and flip this model back to unfavorable.