
Post FOMC decision day pattern suggests higher stock prices

Key points:
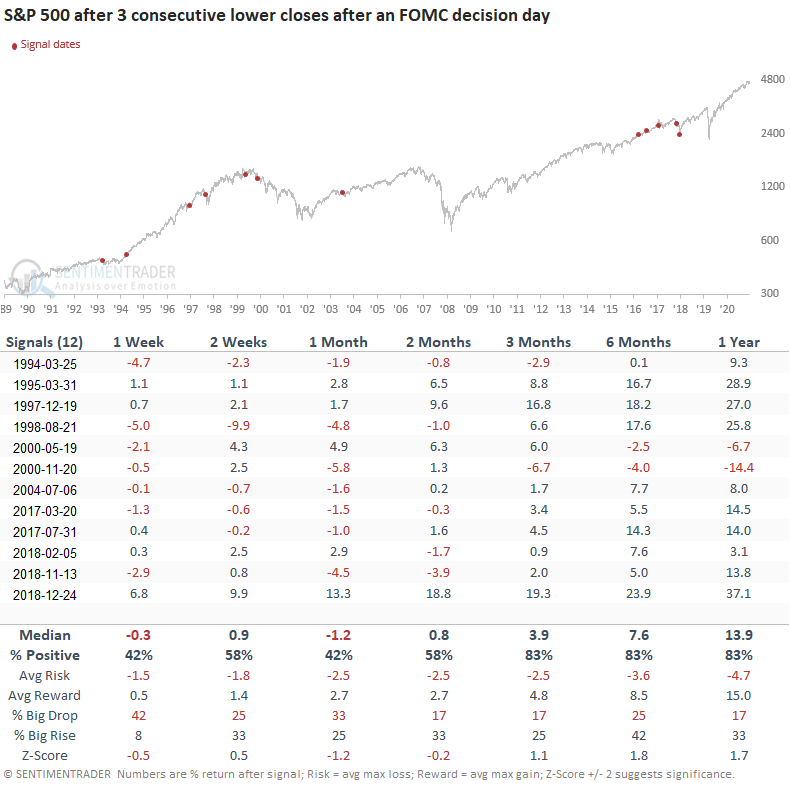
- The market closed lower for 3 consecutive days post the FOMC decision day
- The S&P 500 showed a tendency to rally after other signals
Stock trends around FOMC decision days show a clear pattern
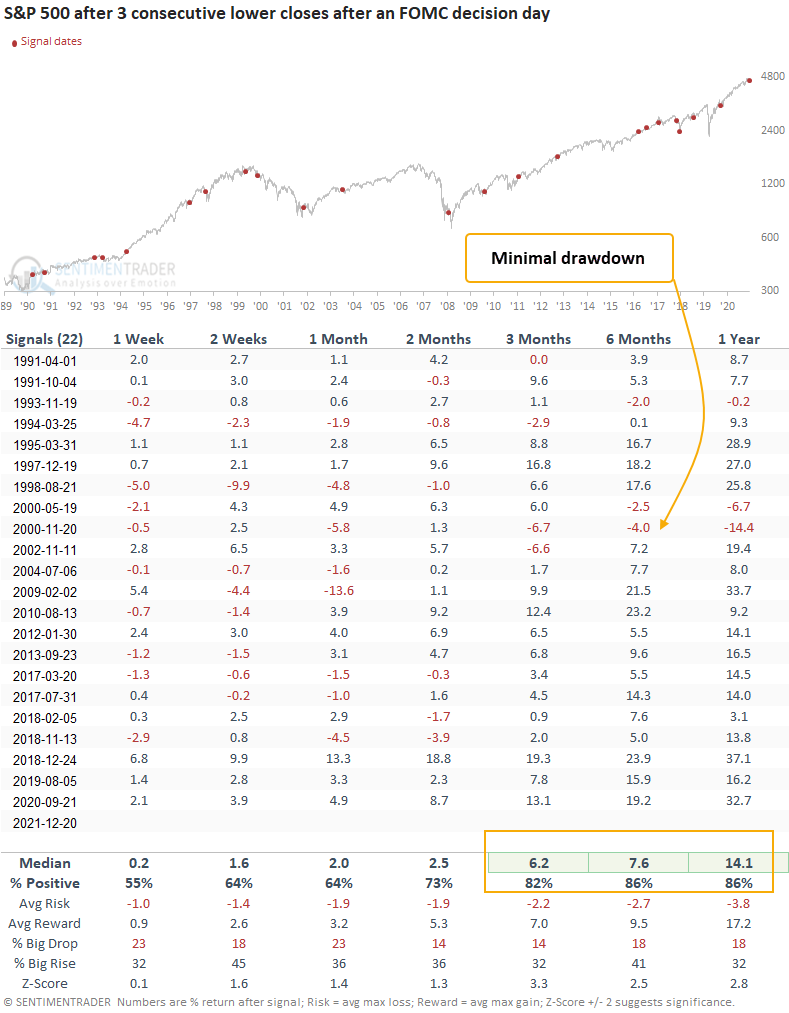
After a significant FOMC decision day stock surge, the hawkish pivot by the fed settled in, and traders sold stocks, with the S&P 500 suffering 3 consecutive negative days of 0.75% or more. Let's assess the outlook for the S&P 500 when the index closes down for 3 successive days post an FOMC decision day.
This signal has triggered 22 other times over the past 31 years. After the others, future returns and win rates were solid across all time frames. The 3-12 month periods show excellent risk-reward profiles. And, the 6-12 month windows are riding a 13 signal winning streak.
Results when the S&P 500 is down 0.5% or more
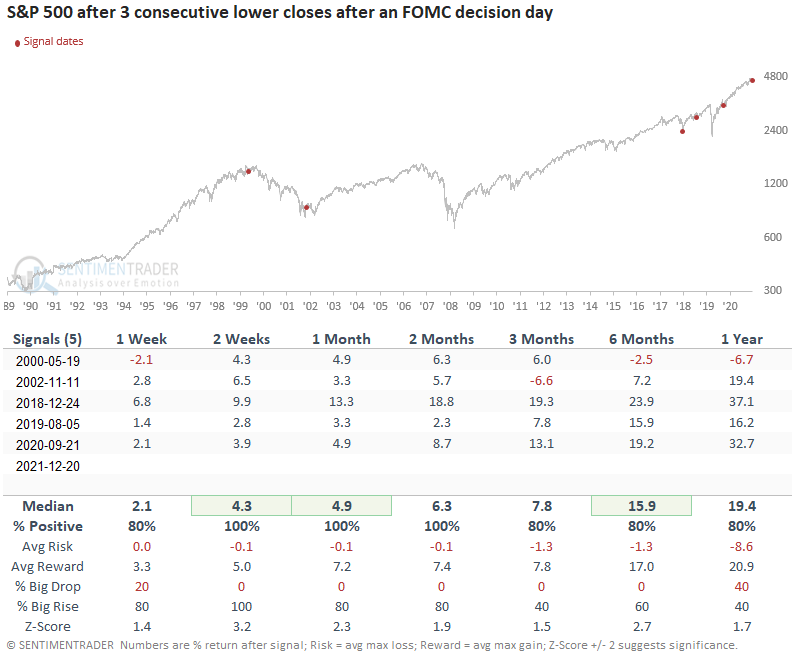
With the S&P 500 down 0.87%, 1.03%, and 1.14% respectively on Thursday, Friday, and Monday, let's isolate historical instances when the S&P 500 closes down 0.5% or more for three consecutive days post a decision day.
This signal triggered 5 other times over the past 22 years. After the others, future returns and win rates were excellent across all time frames. However, we need to be mindful that the sample size is small.
Federal Reserve policy matters
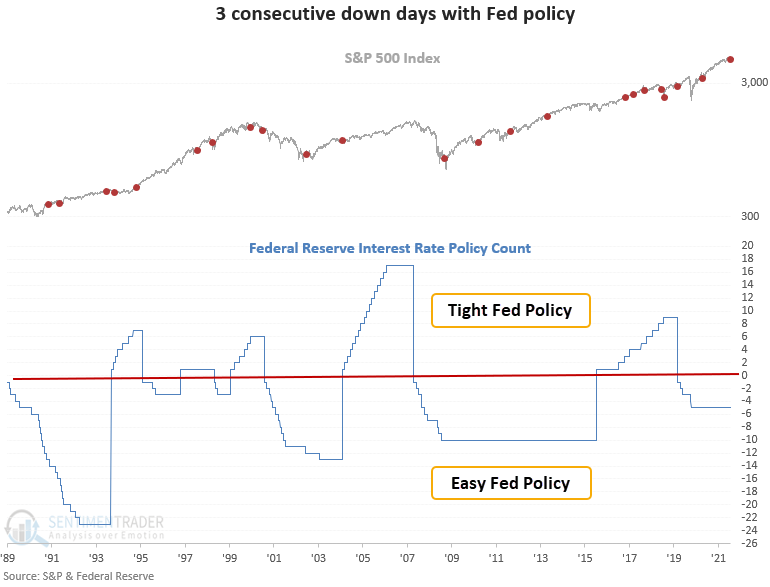
Context is always essential when assessing historical patterns. So, let's evaluate the outlook for the 3 consecutive down days after an FOMC decision day signal when Federal Reserve policy is easy or tight. If the Fed funds interest rate count is greater than 0, the policy is considered tight. Conversely, if the count is below 0, the policy is deemed to be easy. As it stands now, Fed policy remains easy even though the Fed has signaled that they would like to move to a less friendly stance.
Federal Reserve policy is easy
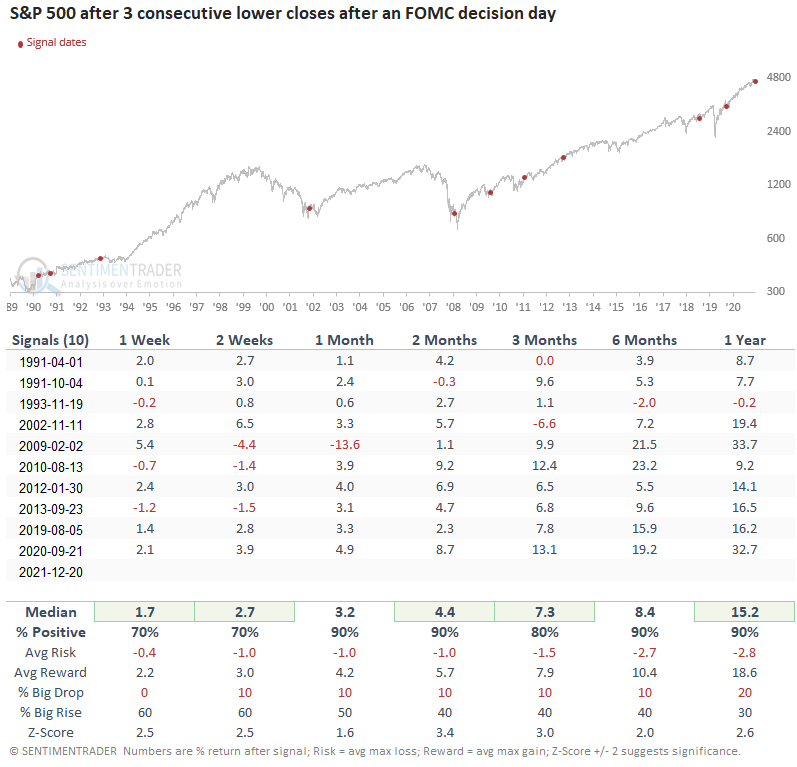
This signal triggered 10 other times over the past 31 years. After the others, future returns and win rates were excellent across all time frames, with several significant z-scores-Fed policy matters.
Federal Reserve policy is tight
This signal triggered 12 times over the past 28 years. After the others, future returns and win rates were weak to slightly in line when looking out 2 months. The medium and long-term time frames show better results and win rates than historical averages.
 What the research tells us...
Stocks tend to rebound after the S&P 500 declines for 3 consecutive days post an FOMC decision day, especially if Fed policy is considered easy. Similar setups to what we're seeing now have preceded solid returns and win rates for the S&P 500 across multiple time frames. If and when Fed policy transitions to a more restrictive stance, we need to be mindful of how a market regime change can impact historical patterns of all types.