Data &
Technology
Research
Reports
Report Solutions
Reports Library
Actionable
Strategies
Free
Resources
Simple Backtest Calculator
Simple Seasonality Calculator
The Kelly Criterion Calculator
Sentiment Geo Map
Public Research Reports
Free Webinar
Pricing
Company
About
Meet Our Team
In the News
Testimonials
Client Success Stories
Contact
Log inLoginSign up
< BACK TO ALL REPORTS

Post-election movements

Troy Bombardia
2020-11-05
Markets made some big moves after the election. There are some clues in these signals, but these clues should be taken with a grain of salt given that markets can be very volatile after major events.

Markets made some big moves after the election. There are some clues in these signals, but these clues should be taken with a grain of salt given that markets can be very volatile after major events.

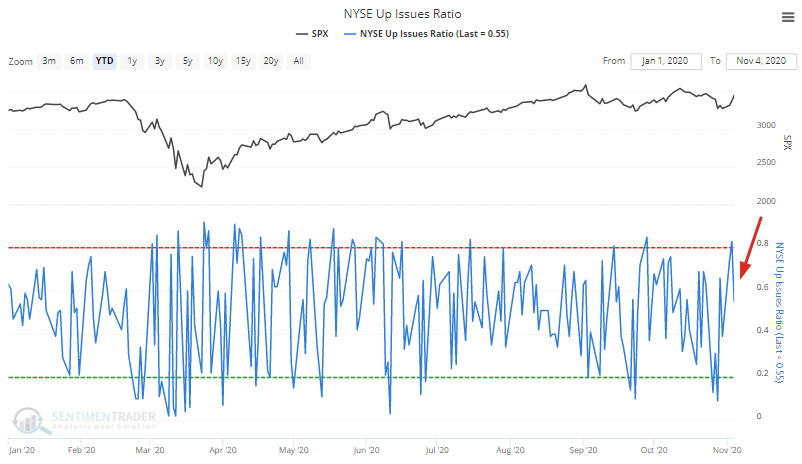
For example, Jason noted that this is the first time in almost 6 decades in which the S&P surged more than 2%, yet less than half of volume flowed into issues that went up. Here's the NYSE Up Issues Ratio:

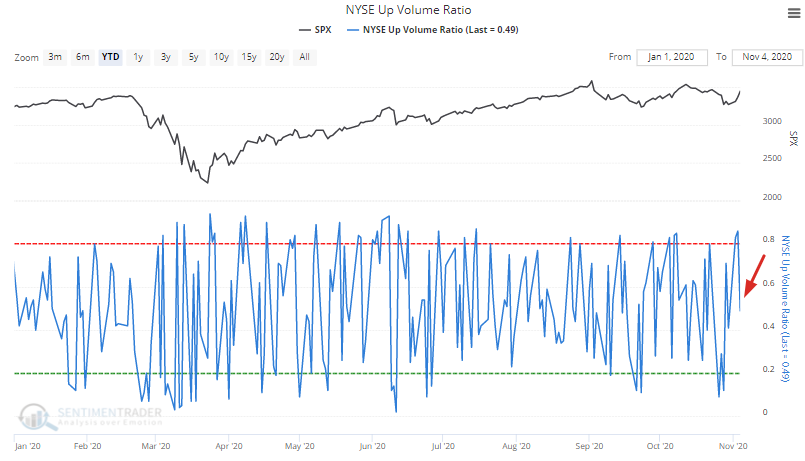
Here's the NYSE Up Volume Ratio:

Given how rare this is, we must loosen the parameters to increase the sample size. The following table looks at what happens to the S&P when it jumps more than 2% in a day, while NYSE Up Volume ratio was less than 2/3:

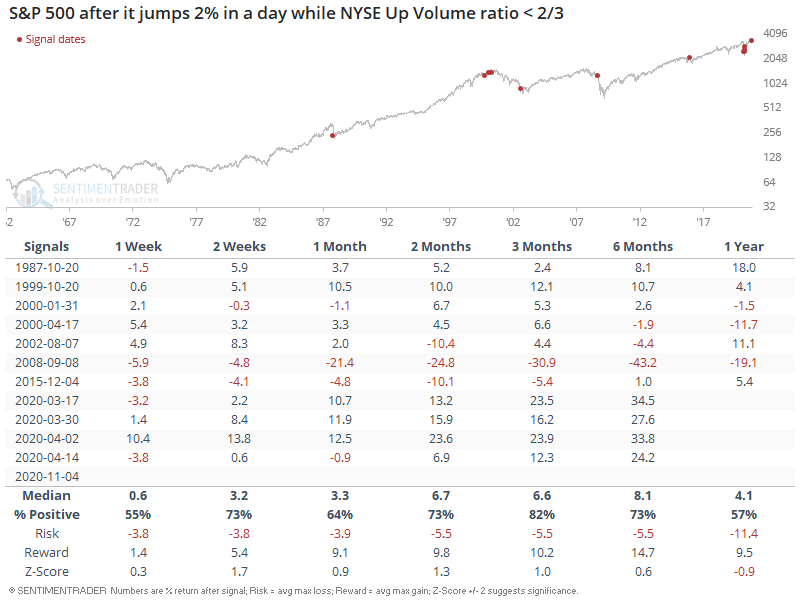
As you can see, this wasn't quite a consistently bearish factor for stocks. But nevertheless, one has to wonder how much this tech-driven rally will last. The general sentiment these days is that "disruption is everywhere. Innovative businesses will survive, and non innovative ones (i.e. not tech) will do worse". While that is true from a corporate revenue perspective, that is not true from a stock price perspective. E.g. Amazon's business grew from 2000-2002. Its stock price still collapsed during those years. Price is what you pay, value is what you get.

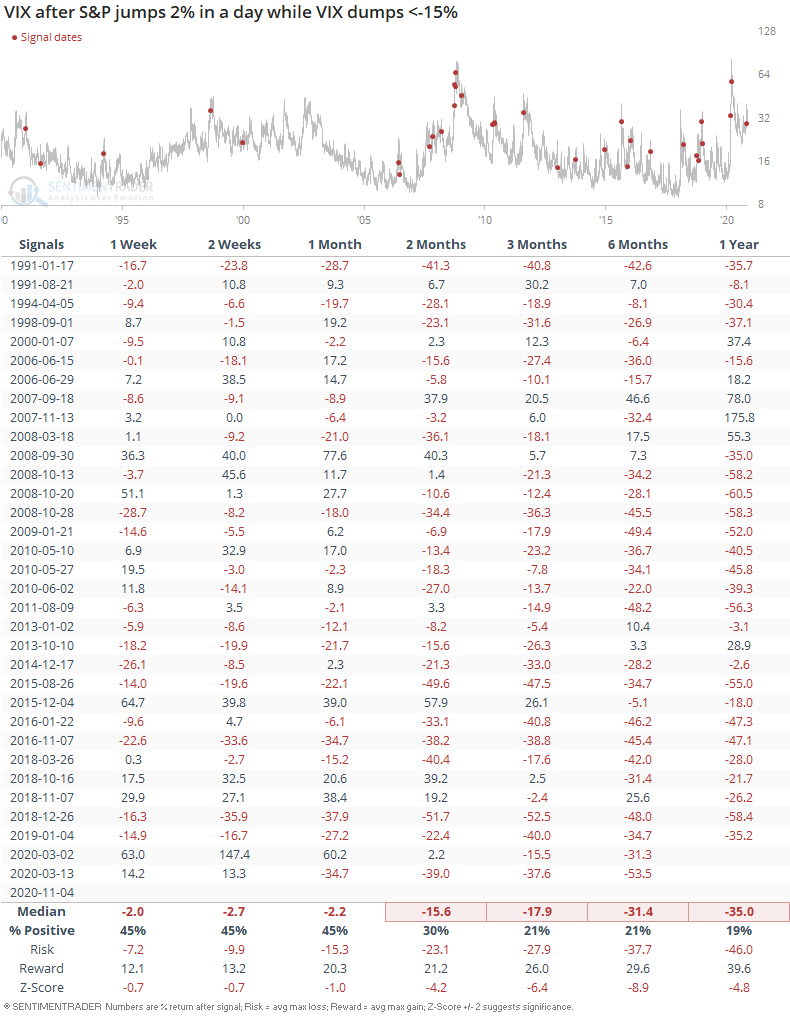
Looking at this from a different way, stocks jumped and VIX dumped:

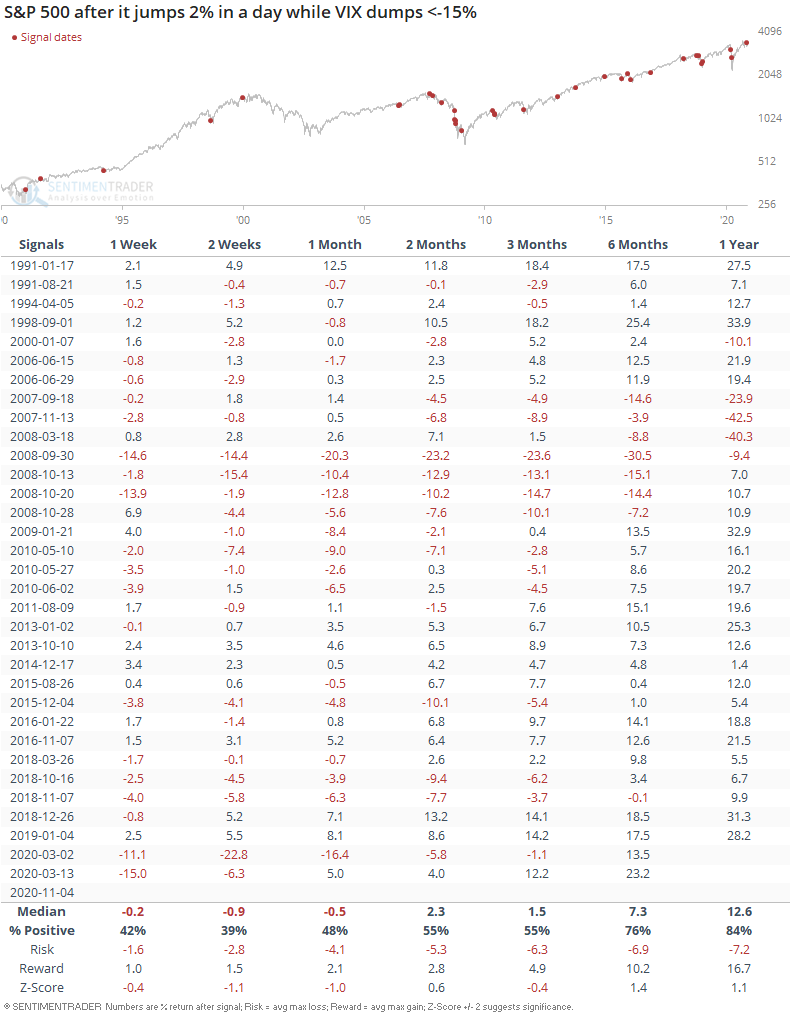
While this wasn't consistently bullish for the S&P, it still mostly led to VIX losses over the next few months:

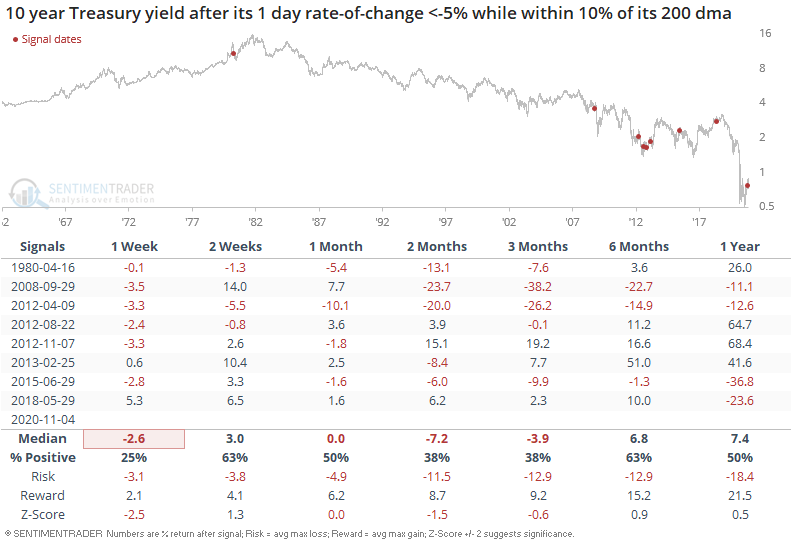
In the bond market, the 10 year Treasury yield slumped:

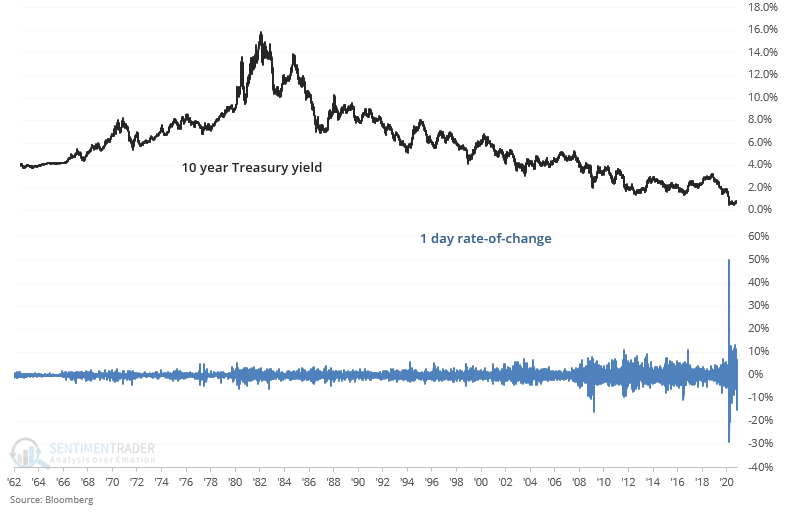
Such 1 day slumps are rare, making it hard to determine whether this is bullish or bearish for bonds:

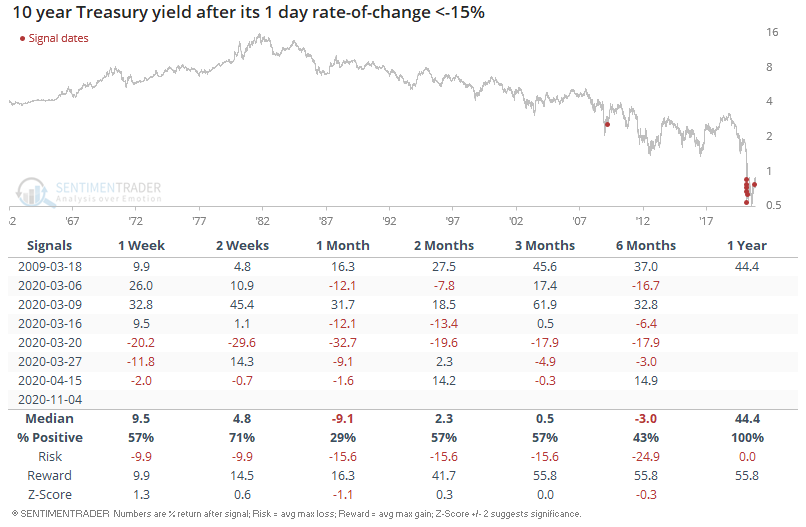
However, one of the more important factors is that the 10 year Treasury yield was rejected at resistance (200 dma):

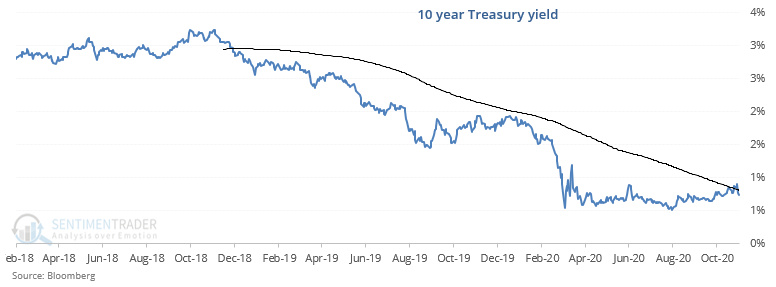
When this happened in the past, the 10 year Treasury yield usually dropped over the next week (bullish for bonds).

Sorry, you don't have access to this report

Upgrade your subscription plan to get access
Go to Dasboard
DATA &
TECHnologies
IndicatorEdge
‍
BackTestEdge
‍
Other Tools
‍
DataEdge API
RESEARCH
reports
Research Solution
‍
Reports Library
‍
actionable
Strategies
Trading Strategies
‍
Smart Stock Scanner
‍
FREE
RESOUrCES
Simple Backtest
Calculator
Simple Seasonality
Calculator
The Kelly Criterion
Calculator
Sentiment Geo Map
‍
Public Research Reports
‍
Free Webinar
COMPANY
‍
About
‍
Meet our Team
‍
In the News
‍
Testimonials
‍
Client Success Stories
Pricing
Bundle pricing
‍
Announcements
‍
FAQ
© 2024 Sundial Capital Research Inc. All rights reserved.
Setsail Marketing
TermsPrivacyAffiliate Program
Risk Disclosure: Futures and forex trading contains substantial risk and is not for every investor. An investor could potentially lose all or more than the initial investment. Risk capital is money that can be lost without jeopardizing ones’ financial security or life style. Only risk capital should be used for trading and only those with sufficient risk capital should consider trading. Past performance is not necessarily indicative of future results.

Hypothetical Performance Disclosure: Hypothetical performance results have many inherent limitations, some of which are described below. No representation is being made that any account will or is likely to achieve profits or losses similar to those shown; in fact, there are frequently sharp differences between hypothetical performance results and the actual results subsequently achieved by any particular trading program. One of the limitations of hypothetical performance results is that they are generally prepared with the benefit of hindsight. In addition, hypothetical trading does not involve financial risk, and no hypothetical trading record can completely account for the impact of financial risk of actual trading. for example, the ability to withstand losses or to adhere to a particular trading program in spite of trading losses are material points which can also adversely affect actual trading results. There are numerous other factors related to the markets in general or to the implementation of any specific trading program which cannot be fully accounted for in the preparation of hypothetical performance results and all which can adversely affect trading results.

Testimonial Disclosure: Testimonials appearing on this website may not be representative of other clients or customers and is not a guarantee of future performance or success.