
Positive economic surprises bode well for stocks

Key points
- After months of economic data threatening recession, things appear to be quietly turning around
- The Economic Surprise Index recently crossed above a critical threshold
- When this happens with the stock market already in an uptrend, historically, that trend tends to persist
The Economic Surprise Index
The chart below displays the Economic Surprise Index versus the S&P 500 Index. This index recently surged to its highest level since March of 2021 before backing off slightly.
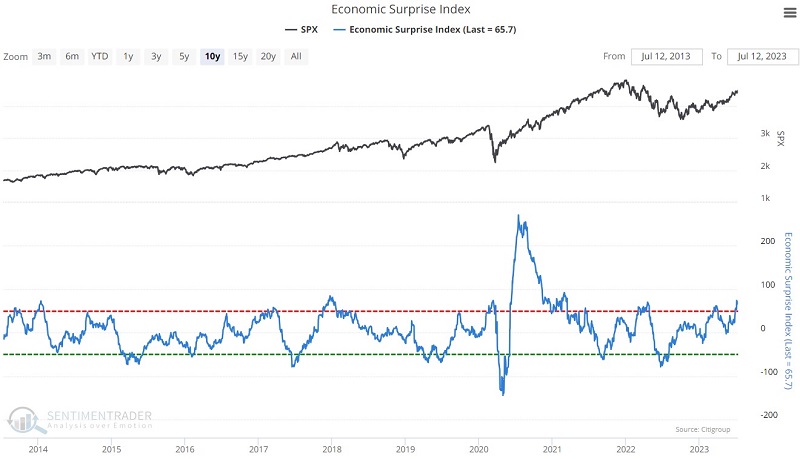
Per our website:
This indicator measures economic surprises for the U.S. market. Citigroup also publishes indicators for other markets, which tend to correlate very closely to the U.S. one.
The Surprise Index weights various economic indicators based on their influence in the foreign exchange market on the day they are released. From this group of indicators, they look at the standard deviation of the actual release versus economists' estimates. The indicator, as shown, is a three-month average of the raw daily figure.
If the Surprise Index is above zero, then it means that economic releases have been coming in over the past three months better than analysts had estimated; if below zero, economic releases have been worse than expected.
The indicator is essentially bound by +100 and -100, but its upper limit has tended to be closer to +75. It regularly bounces between the two extremes due to the adaptive tendencies of analysts.
Analysts will increase their estimates for future releases if economic results show consistent positive surprises. That means that those future releases will have a higher hurdle to overcome, and eventually, it becomes so high that they are bound to disappoint, sending the Surprise Index lower.
The same goes for the reverse - if economic results have been terrible, analysts will ratchet down their future expectations, and those future releases will have a better chance of beating estimates, causing the Surprise Index to rebound.
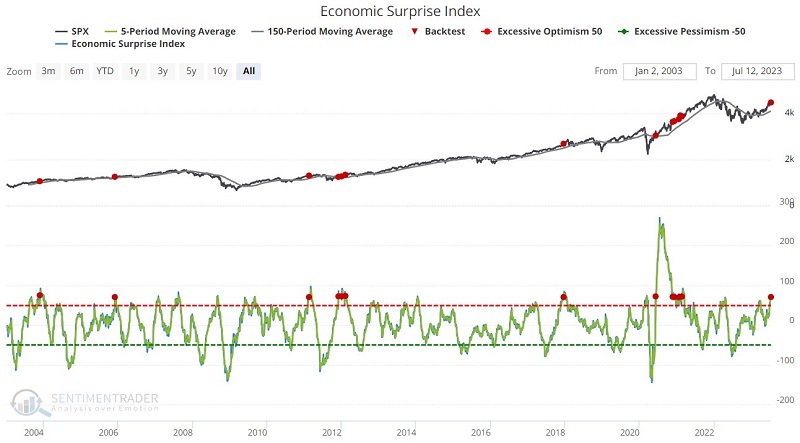
Increasing surprises in an up-trending market
The chart below highlights those times when:
- The 5-day moving average of Economic Surprises crossed above 70
- While the S&P 500 Index was above its 150-day moving average
For this test, we include all signals, including overlaps.
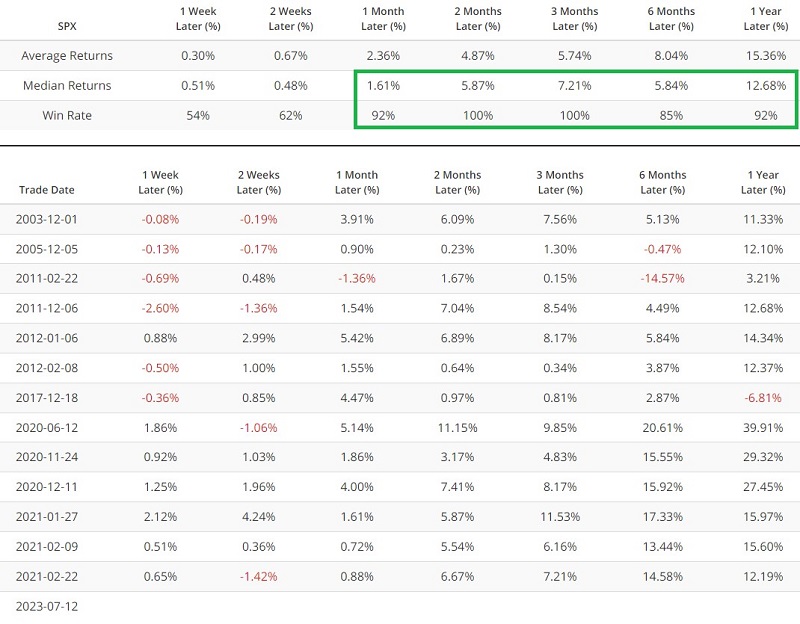
The table below summarizes S&P 500 performance following previous signals.
Removing overlaps reveals a potential short-term edge
Signals sometimes come in clusters as in 2011-2012, 2020, and 2021. The chart below highlights those times when:
- The 5-day moving average of Economic Surprises crossed above 70
- While the S&P 500 Index was above its 150-day moving average
- For the first time in six months
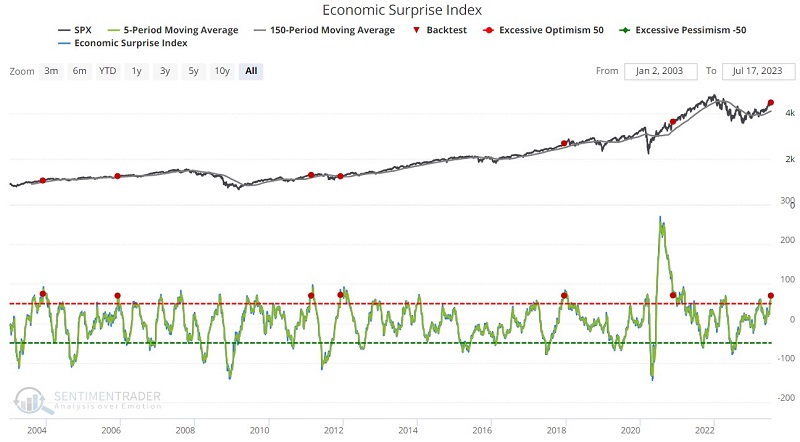
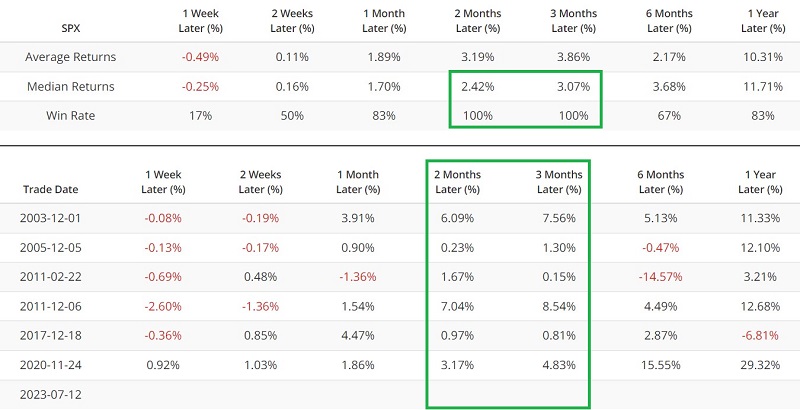
In this test, six and twelve-month returns were not quite as robust. However, one to three-month performance showed notable Win Rates.
What the research tells us…
Just as the stock market hates uncertainty, it also loves unexpected positive results. Historically when the Economic Surprise Index jumps to a high level - especially when stocks are already in an established uptrend - the market has continued to follow through in the months ahead. While the stock market currently appears somewhat overextended on a short-term basis, this indicator suggests that investors "let it ride" for at least a few more months.