Positive Breadth Divergence; Growth Worries

This is an abridged version of our Daily Report.
A positive divergence
When the S&P fell to a 6-month low last week, significantly fewer of its individual stocks did so, creating a positive divergence in its Advance/Decline Line.
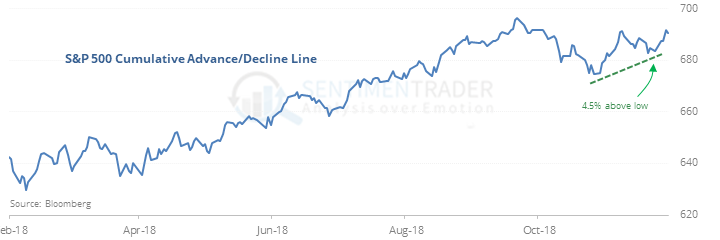
That looks pretty on a chart, but it hasn’t been consistent enough, and underperformed days when there was no divergence at all.
A better sign is that the S&P surged to its best gain in 7 years following last week’s 6-month low. Longer-term, they tended to be a good sign, with rallies over the next 6 months after 9 of the 11 signals. The only real bull traps, sucking in buyers only to reverse into a protracted decline, were in 1956 and 1974.
Growth worries
A popular aggregate economic model from ECRI is showing a sudden downturn in its growth rate, ending one of the longest streaks in growth mode (or at least not large contractions).
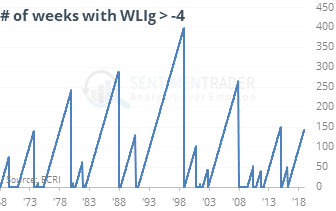
It is very near the average level at the start of other recessions in the past 50 years. By the time it fell to this level, the S&P 500’s future returns were weak, but not quite consistent enough to call it a sell signal.
Cash flow
Mutual fund managers increased their cash level to 3.2% of assets in October, and assets in equity funds fell to 4.7 times the amount in money markets. Both are off their all-time extremes but have a long way to go before even hinting at pessimism.
The latest Commitments of Traders report was released, covering positions through Tuesday
The 3-Year Min/Max Screen shows that “smart money” hedgers moved to only one new multi-year extreme, a long position in Ultra 30-year Treasuries.