
Poor environment coupled with high optimism

The Bottom Line part of the Dashboard and Daily Report hasn't changed too much in recent weeks. The overall theme is that we're seeing extreme optimism during an unhealthy market environment.
MARKET ENVIRONMENT
There are a number of ways to define this. Simply looking for prices above/below the 200-day moving average works just about as well as complex trend models, and it's a good, clear-defined alternative. Combine that with a simple view of whether prices are making higher highs and higher lows (bull trend), lower highs and lower lows (bear trend), or both (neutral trend) and you can get an excellent sense for whether bulls or bears are in control. Those are mixed right now, with a slight edge to the bullish camp.
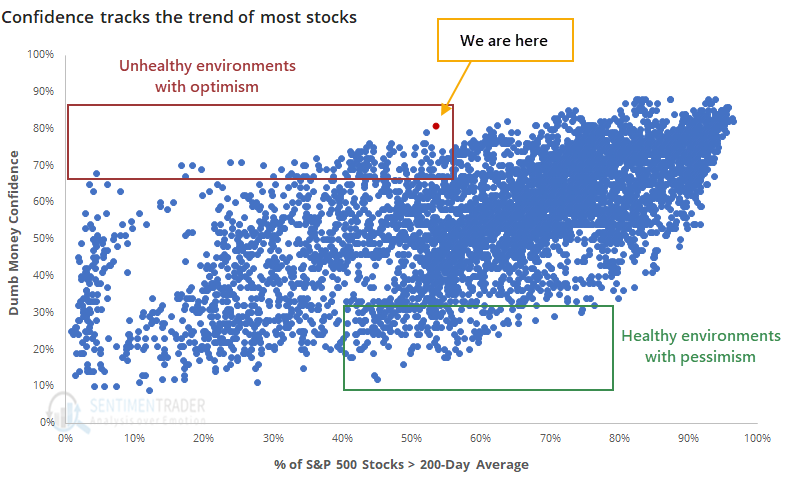
Another of our preferred methods is looking at participation - how many securities are in uptrends/downtrends.
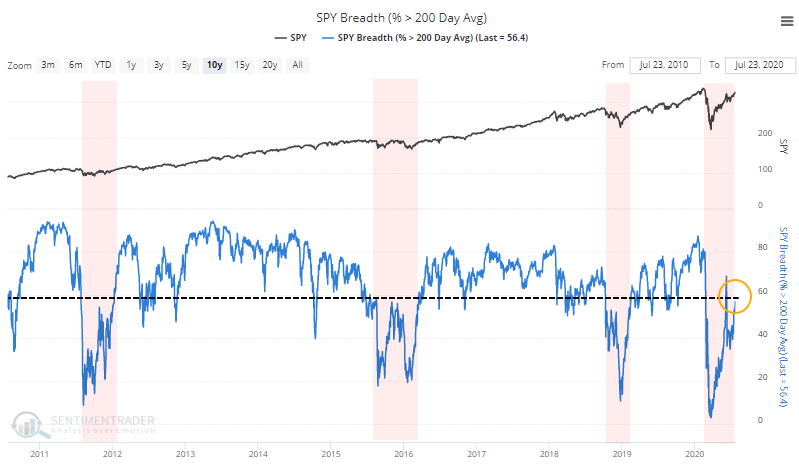
Healthy environments consistently see more than 60% of stocks, industries, sectors, and countries holding above their 200-day averages. When it dips below 40% (and especially below 20%), it's usually only temporary and proves to be good buying opportunities. Unhealthy environments consistently see fewer than 60% of these above their averages, and spikes above that level tend to get sold quickly.
That's where we are now. In addition to a large number of stocks trailing the S&P by double-digits, fewer than 60% have been able to hold above their 200-day averages. When it spiked above 60% in June, selling pressure picked up immediately.
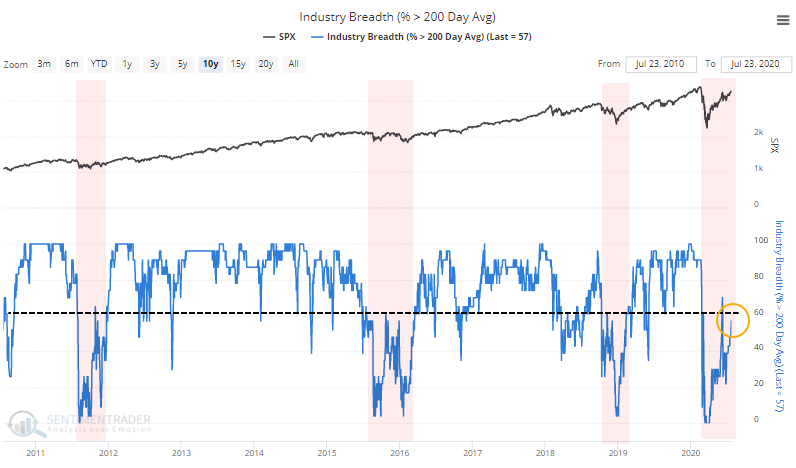
Same for industries...
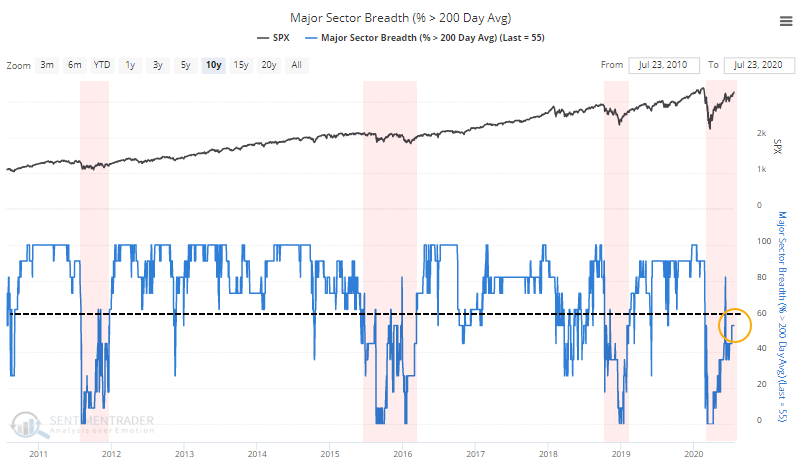
...and sectors...
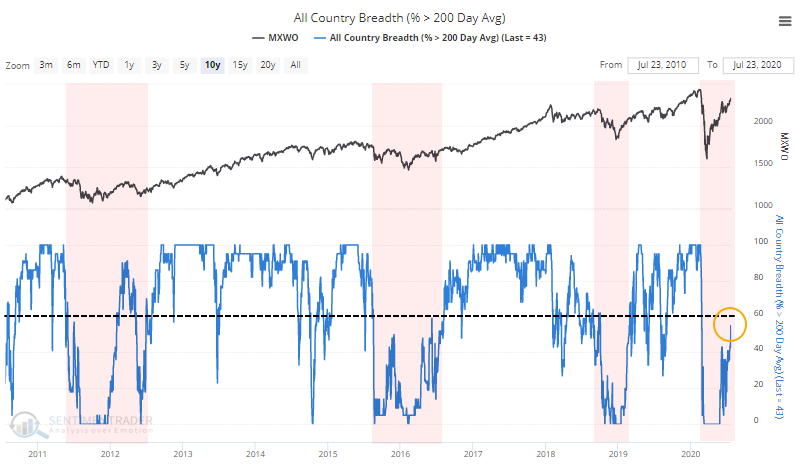
...and countries.
These are not on/off switches, but rather general reflections of the environment. As long as these metrics consistently hold below 60%, signs of excessive optimism tend to lead to very poor forward returns. That's where we are now, along with seeing the top 5 stocks dominate the indexes and mask some poor underlying participation.
SENTIMENT
As we saw last week, optimism is extremely high. Dumb Money Confidence has been hovering at or above 80%, which has preceded poor returns, especially in recent years.
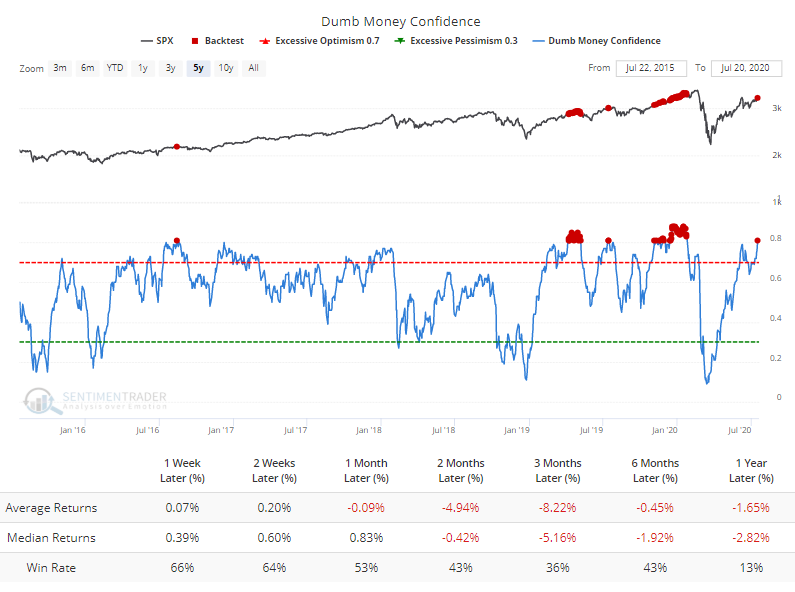
Helping to push this higher was recent record-setting option speculation. Even though some of the market's leaders stumbled last week, the Options Speculation Index remains near a 20-year high. Plus, we have the added headwind of being in the most seasonally unfavorable period for stocks.
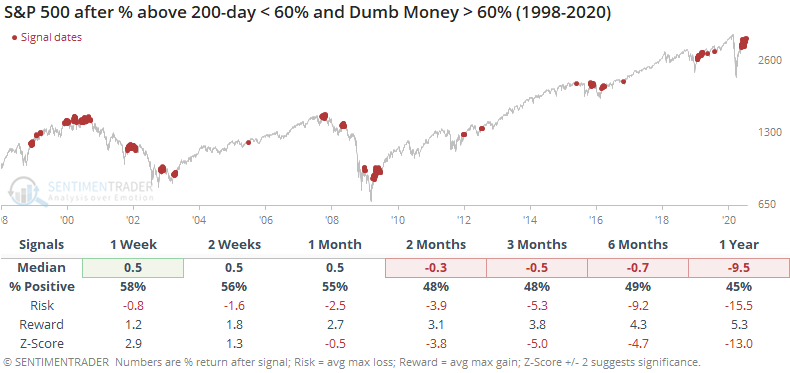
We've often noted that during times of unhealthy market environments, when fewer than 60% of stocks can hold above their 200-day averages, that periods of high optimism tend to lead to below-average forward returns.
We're seeing that now, to a historic degree. Since we've been tracking this data, just over 20 years, there has never been a day when Dumb Money Confidence was at or above 80% while fewer than 60% of stocks in the S&P 500 were trading above their 200-day averages. Until now.
Historically, the combination of relatively few stocks in uptrends and high overall optimism has led to poor returns.
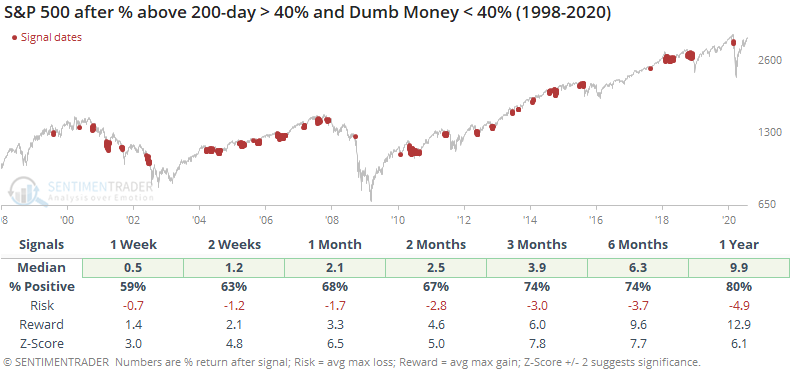
Contrast that to times of generally healthy environments coupled with low optimism.
The two most important factors for determining multi-month risk/reward, at least how we see it, are market environment and sentiment extremes. Both are now skewing heavily to the "risk" side of the ledger.
The wild cards that have existed since March continue to lurk - whether the promise of a vaccine/treatment along with a historic bucket of fiscal and monetary stimulus are enough to override any and all technical, fundamental, or behavioral factors, even over shorter time frames like several weeks to several months. The evidence is mixed on that front, so, for now, the view is that the medium-term has significantly higher-than-normal risk.