
Piling On Brazil

In this piece, Jason covered in great detail the amount of fear and loathing recently encompassing the Brazilian stock market. In this piece, I will add two more pieces to the same puzzle.
IBOV MCCLELLAN SUMMATION INDICATOR
The chart below displays a bar chart of ticker EWZ (iShares MSCI Brazil ETF) those occasions when the McClellan Summation Index for the Brazilian Ibovespa Exchange crossed below -1300.
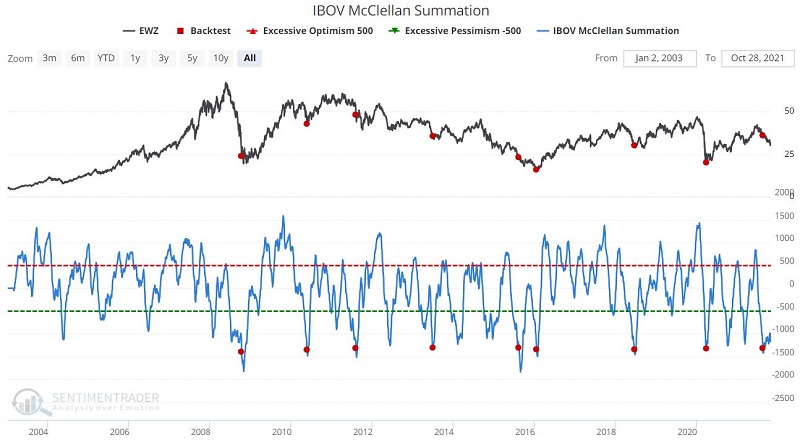 As you can see, this signal occurs relatively infrequently. You may also note just from a visual analysis that it tends to be "early." The numbers bear this hunch out. The table below displays the summary of results basis ticker EWZ.
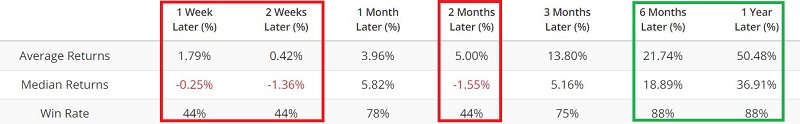 Note that 1-week, 2-week, and 2-month returns show a Win Rate of only 44%, while 6-month and 1-Year returns show a Win Rate of 88%.
In the screenshot below, note the performance for EWZ if held from:
- 2 months after an IBOV McClellan Summation signal
- To 12 months after an IBOV McClellan Summation signal
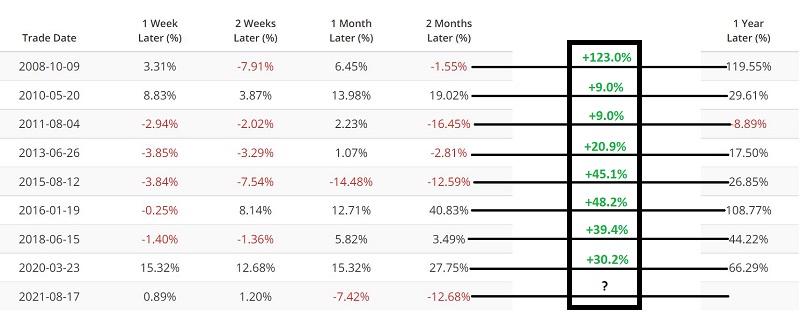 As you can see in the image above, following all 8 previous signals, ticker EWZ moved higher during the 10 months between 2 months and 12 months after the signal.
- Average 10-month gain = +40.6%
- Median 10-month gain = +34.8%
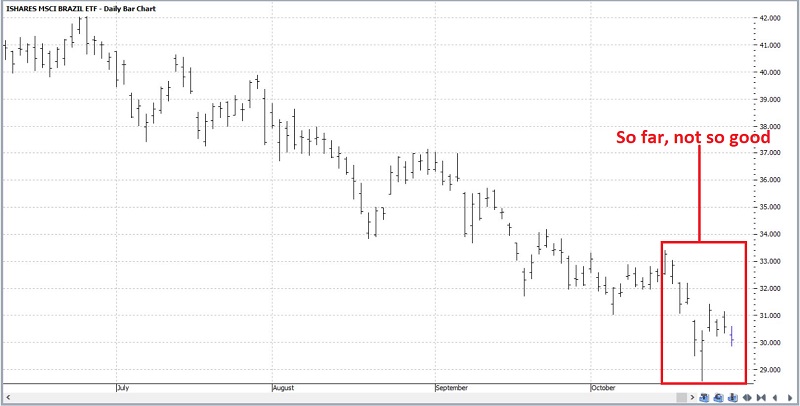
The most recent signal occurred on 8/17/2021, so for this trend to hold, EWZ would need to rise between 10/17/2021 (2 months after the latest signal) and 8/17/2021 (12 months after the latest signal). How is it going so far? Not good at all. As you can see in the bar chart below (courtesy of ProfitSource), EWZ has declined another -9.5% since 10/15.
Will things turn around over the next 10 months? I can't predict. But from a contrarian point-of-view, it doesn't get much more contrarian than this. At the same time, more patience may be in order. Remember that the Backtest Engine scan in Jason's original article suggests that we may still be months away from an actual bottom. Note also that the indicator Jason highlighted shows the same tendency as the one above, i.e.:
- Poor performance during the 1st 2 months after a signal
- Terrific performance during the ensuing 10 months
Whether a speculator chooses to jump in sooner or later, there are two things to remember:
- History suggests that once the washout in Brazil runs its course, a rip-roaring rally may be in the works. So even if one decides that "now is not the time," the message is "keep Brazil on the radar." And remember that if it gets worse in the short term, it may be creating an even better opportunity down the road.
- The other question is "how to play?" this situation when the time comes.
AN ALTERNATIVE PLAY
Possibly the most straightforward approach to trading the Brazilian stock market is to buy shares of ETF ticker EWZ. At its recent closing price of $30.09 a share, an investment of $3,009 is required to buy 100 shares. However, because the Brazilian stock market is so volatile and more of a speculation, let's look at an example trade with a lower dollar commitment.
Our example trade involves:
- Buying 1 EWZ Oct21 2022 Call @ $5.45
- Selling 1 EWZ Oct21 2022 Call @ 0.36
The particulars and risk curves for this trade appear below.
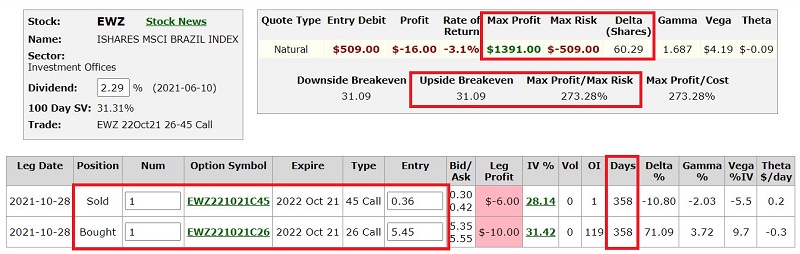
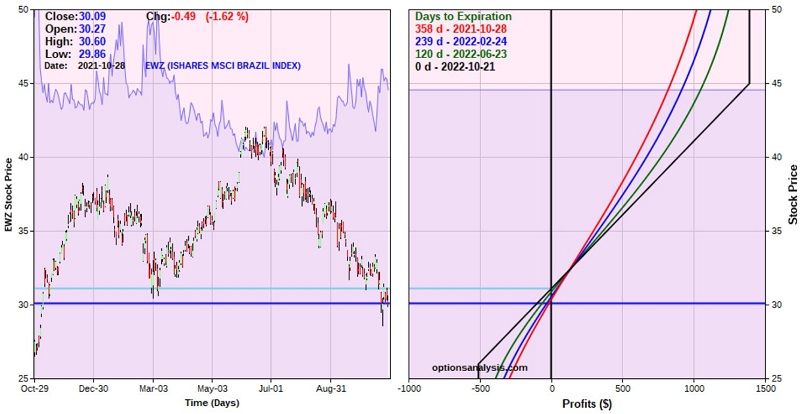
In a nutshell, this is a trade with a defined maximum risk (-$509) and a lot of time for things to work out (358 calendar days).
Things to note:
- At the time of entry, this trade has 358 days left until expiration
- Buying a 1 lot gives this trade a delta of 60.29. This means that (for now) this position will behave like a position holding roughly 60 shares of EWZ.
- The cost to enter this trade is $509 versus $1,805 to buy 60 shares of EWZ stock.
- The maximum profit potential is $1,391 if EWZ is at $45 a share at option expiration.
- The maximum risk is -$509 if EWZ is below $26 a share at option expiration.
The example trade above allows a speculator to put on something of a "set it and forget it" position in a market with explosive potential in the year ahead.
Is it too soon to jump into this troubled market? That's for each trader to decide for themselves. But whenever the time comes to "take the plunge," it may be useful to consider the unique possibilities available via options on ticker EWZ.