
PE/VIX Spread and SPY New Low % flash potential warning signs

Key points
- The PE/VIX Spread recently turned down from an extreme level
- The SPY New Low % indicator recently spiked to a critical level
- In the past, both of these readings have often been followed by lackluster and subpar stock market performance
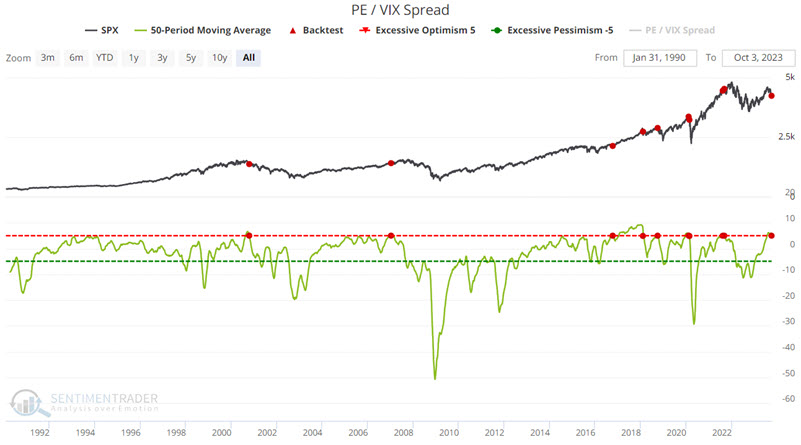
PE/VIX Spread crosses a threshold
Per our website:
The PE/VIX Spread shows the spread between the forward price/earnings multiple on the S&P 500 and the VIX volatility gauge. The higher it is, the more investors are willing to value stocks while not suffering the consequences of high volatility, which tends to lead to poor future returns. A very negative spread shows that investors may be pricing in too great of a price swing relative to the earnings that stocks will likely generate.
Like many indicators that can reach extreme readings, it is not so much the extreme reading itself - but rather the reversal from an extreme reading - that appears to matter most.
The chart below highlights those times when the 50-day average for the PE/VIX spread crossed below 5.0. The most recent signal occurred on 2023-10-03.
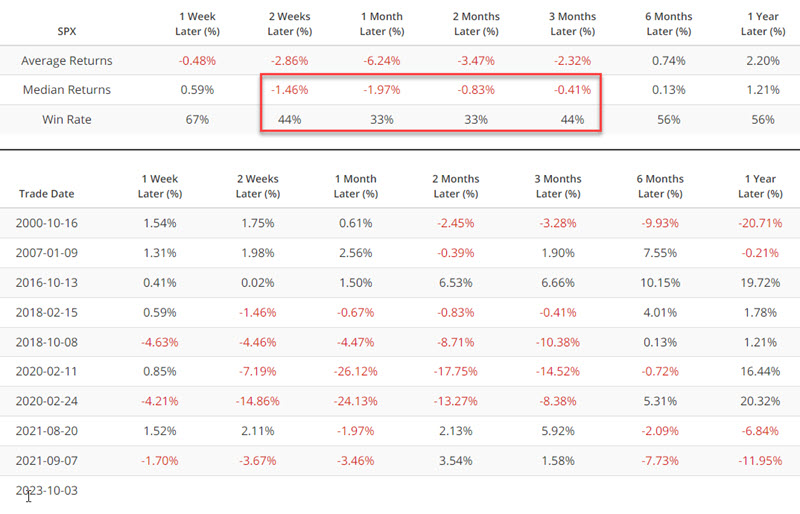
The table below summarizes subsequent S&P 500 performance. Note that the market tends to show weakness during the three months after a signal. Even the six and 12-month Median Returns and Win Rates are very subpar.
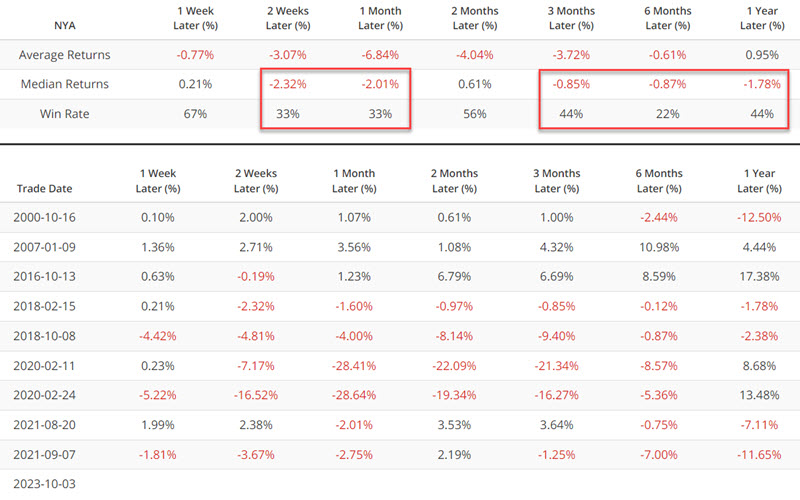
We see even weaker results if we broaden out even more and test the New York Stock Exchange Index (NYA).
It is important to note that this signal is not a "sell everything and head for the hills" indication. Market gains followed signals in 2007, 2016, and 2020. Nevertheless, the overall median results are a warning sign that stock investors may need to temper their expectations for the year ahead.
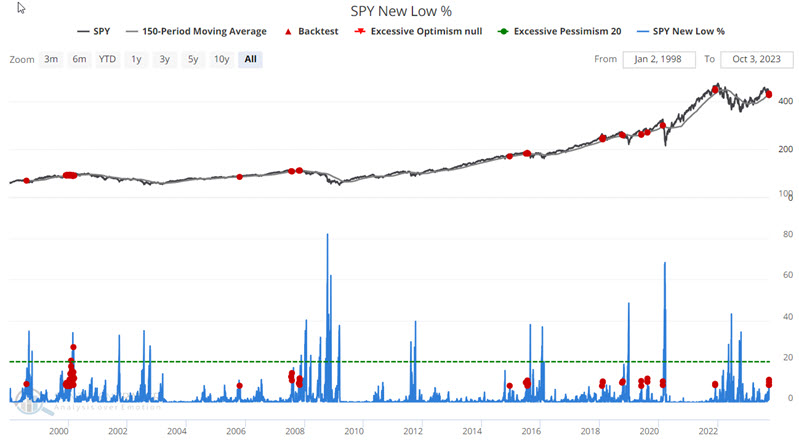
SPY New Low % also flashes a potential warning sign
As the name implies, the SPY New Low % indicator shows the percentage of stocks in the SPDR S&P 500 ETF Trust (SPY) currently trading at a new 52-week low.
An increase in the number of stocks reaching a new 52-week low is objectively a sign of weakness in the market. For the record, it can be a bullish oversold signal when things get overdone - i.e., when a huge percentage of stocks (say 40% or more) reach new lows at once. However, the latest action in SPY new lows is not encouraging for now.
The chart below highlights those dates when the SPY New Low % indicator was above 8% while SPY was above its 150-day moving average. This represents a situation where apparent strength in the overall index is masking a lot of internal weakness. The most recent signal occurred on 2023-10-02.
The table below summarizes subsequent SPY performance.
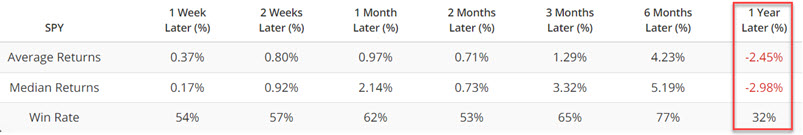
In a nutshell, the results are just plain weird. Median Returns and Win Rates are decent, if not necessarily above average, through six months. However, the 12-month results are negative and far below average. So, once again, we are not talking about an immediately actionable "sell signal." This appears to be more of a "shot across the bow" to investors to alert them that things may get even more tricky in the year ahead.
What the research tells us…
Not every squiggle from every indicator means something. Likewise, not every indicator signal should be relied upon as a "buy" or "sell" signal. We generally prefer a weight-of-the-evidence approach. That said, it should be noted that we have highlighted a large number of indicators flashing favorable signals in recent months. But it is also a mistake to ignore warning signs like those highlighted above.