
Percentage of Members Outperforming the S&P 500 Index

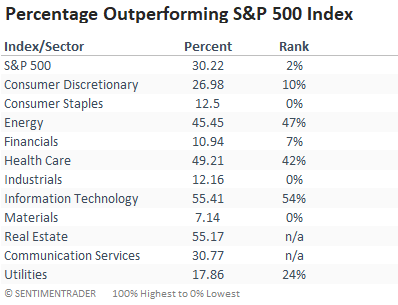
The wild swings in the percentage of members outperforming the S&P 500 index continue with the indicator falling to a historically low level for the second time in less than a year. According to our calculation, only 30.22% of S&P 500 stocks outperformed the Index on a rolling 21-day basis as of 6/28/21. If I compare that level to all other values since 1927, it returns a rank in the 2nd percentile. If we look at sector levels, one can see that the percentile ranks for staples, industrials, and materials reside around the lowest levels in history. Interestingly, the energy sector looks good on a relative basis. The sector ranks started in 1952.
The sector table provides a clear picture of the short-term performance disparity between growth and value-oriented groups.
Let's conduct a study to assess the forward return outlook for the S&P 500 when the percentage of members outperforming the index falls below 30.25%. I will also require the index to be within 1% of a 252-day high and include a reset condition whereby the indicator has to cross back above 50% for another signal to occur. The reset condition screens out duplicate signals.
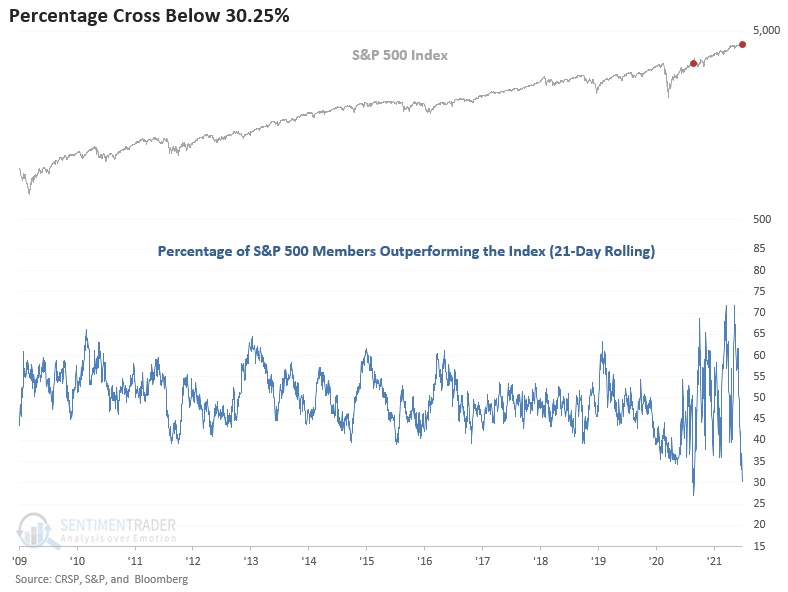
CURRENT DAY CHART
The last time the indicator fell to a level around the current reading, the S&P 500 rallied for an additional eight trading days before correcting by 9.6% on a closing basis in September 2020.
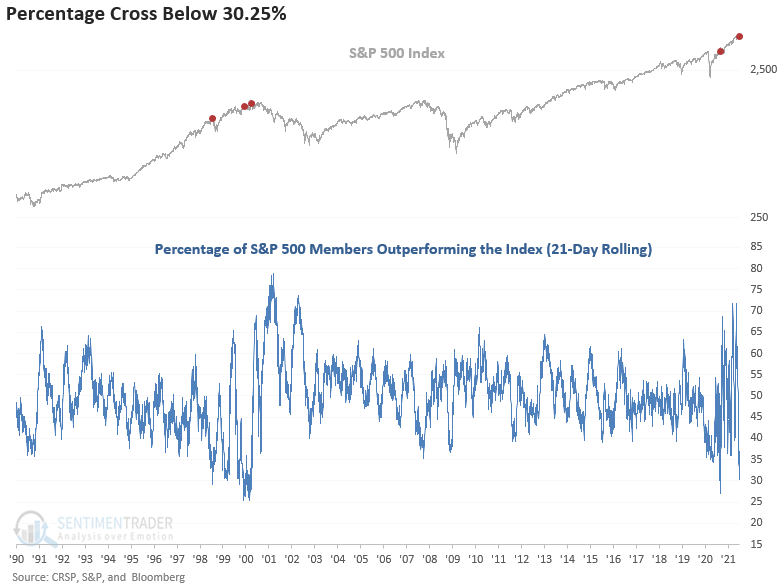
SINCE 1990 CHART
The tail-end of the Dotcom bubble provides the most recent analog to the current-day swings in the indicator.
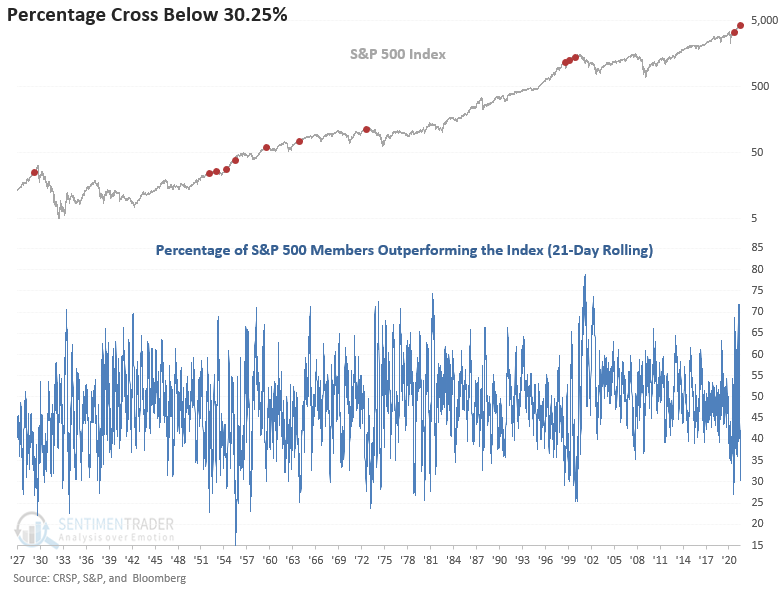
HISTORICAL CHART
HOW THE SIGNALS PERFORMED
With only 12 signals since 1927, the level of members outperforming the index is historic. The returns in the 2-4 week timeframe are relatively weak, while other periods show somewhat muddled returns. I would also note that some of the signal dates like 1929, 1972, and 1999 are concerning.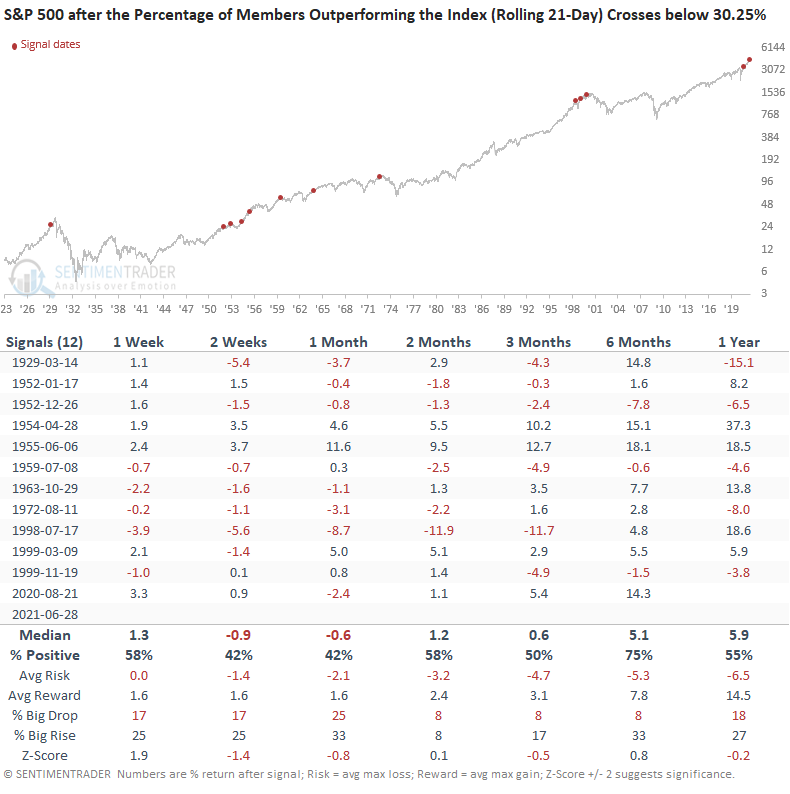
As Jason and I have noted in recent notes, participation on a short-term basis is not ideal. However, the market continues to steam ahead. Can the short-term measures catch up to price? That continues to be the million-dollar question.