Percentage of members above the 50-day average buy signal
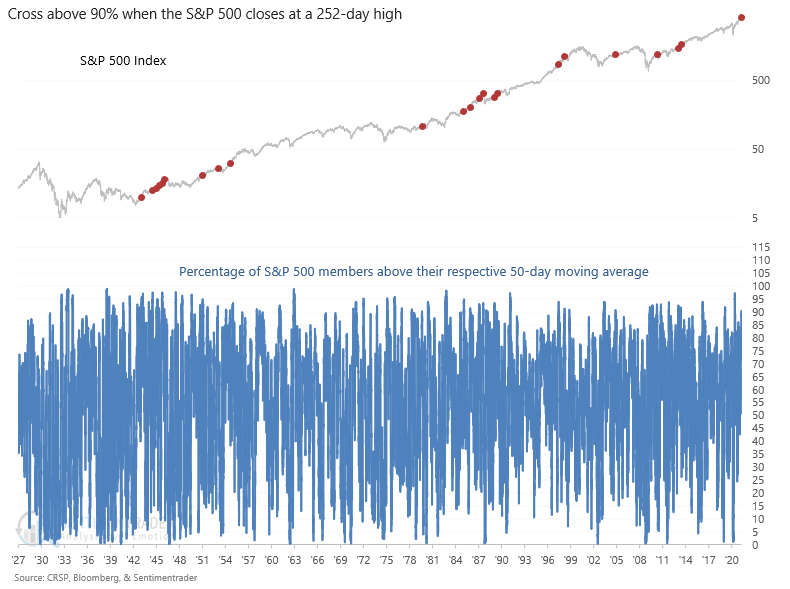
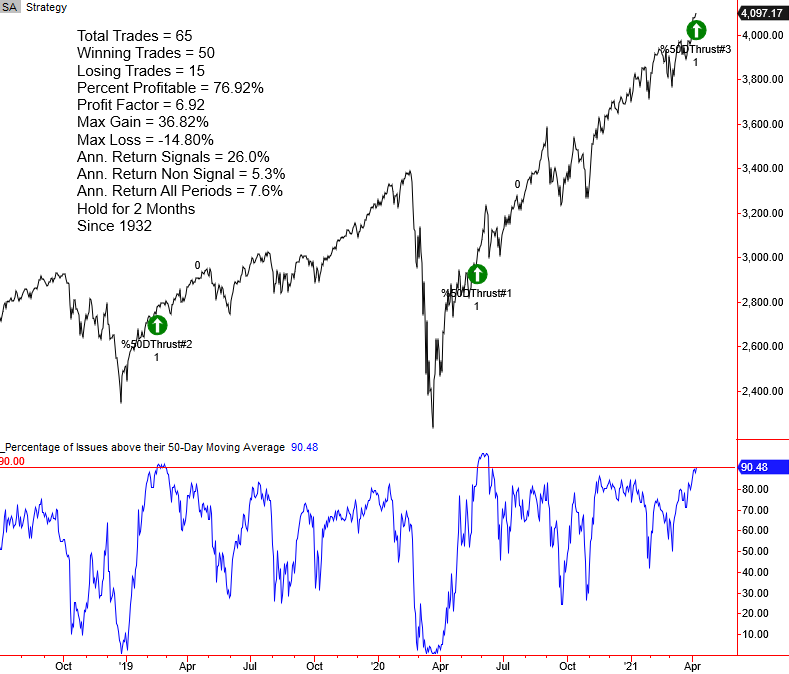
The percentage of S&P 500 members trading above their respective 50-day moving average registered an overbought momentum buy signal on the close of trading on 4/8/21. The cross above 90% signal is one of the better components in the TCTM Composite Thrust Model as it has an excellent risk/reward profile. However, the new signal occurred at a 252-day high. I think it's always essential to put some context around trading signals as instances that occur after a bear market or a correction can influence overall signal performance.
Let's review signal performance under the following conditions.
- 252-Day High Signals (Current New Signal)
- Correction Signals
- Bear Market Signals
- All Signals
Please note, I use a cross below 50% as a reset condition to avoid duplicate signals.
Signals at a 252-Day High

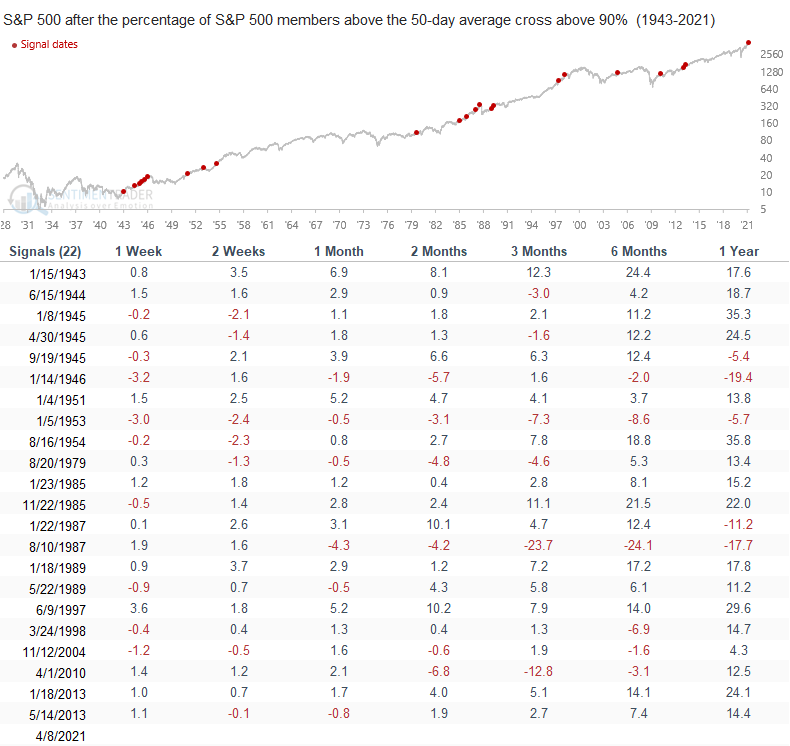
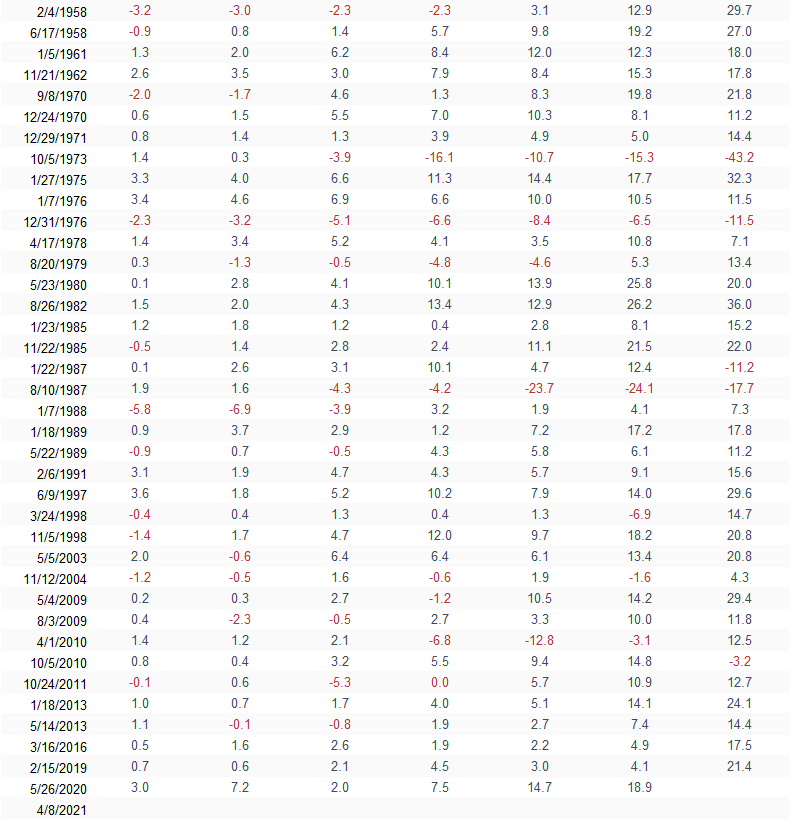
Signal Performance at a 252-Day High
Signal performance looks good even when it occurs at a 252-day high. Several of the timeframes show a notable z-score.

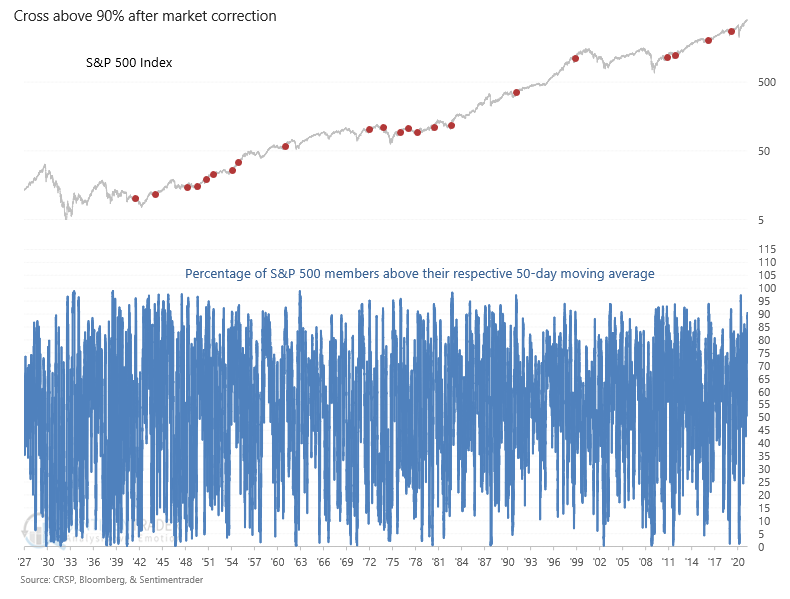
Signals after Correction (>0% <20% from Peak)
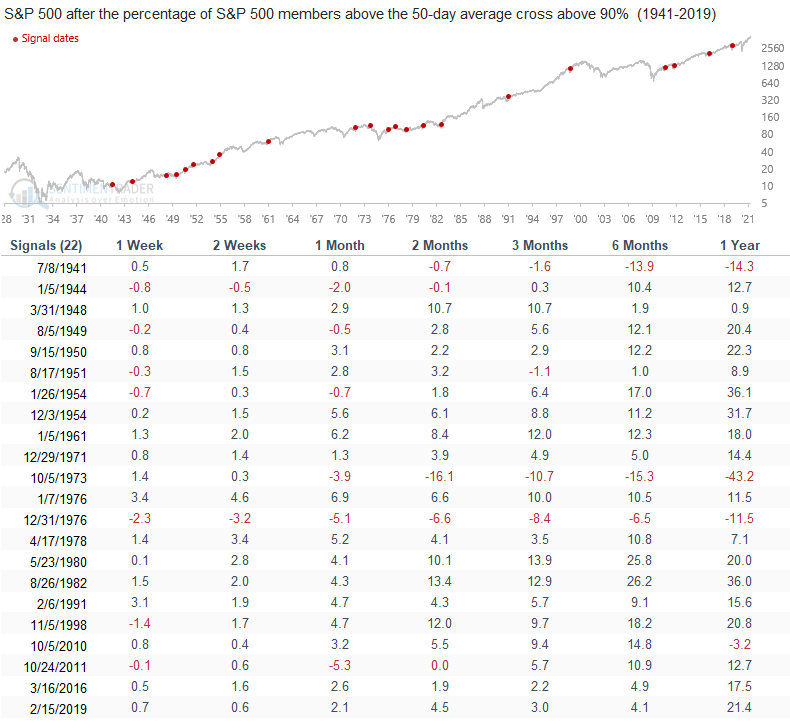
Signal Performance after Correction (>0% <20% from Peak)
Market correction signals look very robust, with 6/7 timeframes showing a z-score above two.

Signals after Bear Markets (>20% from Peak)
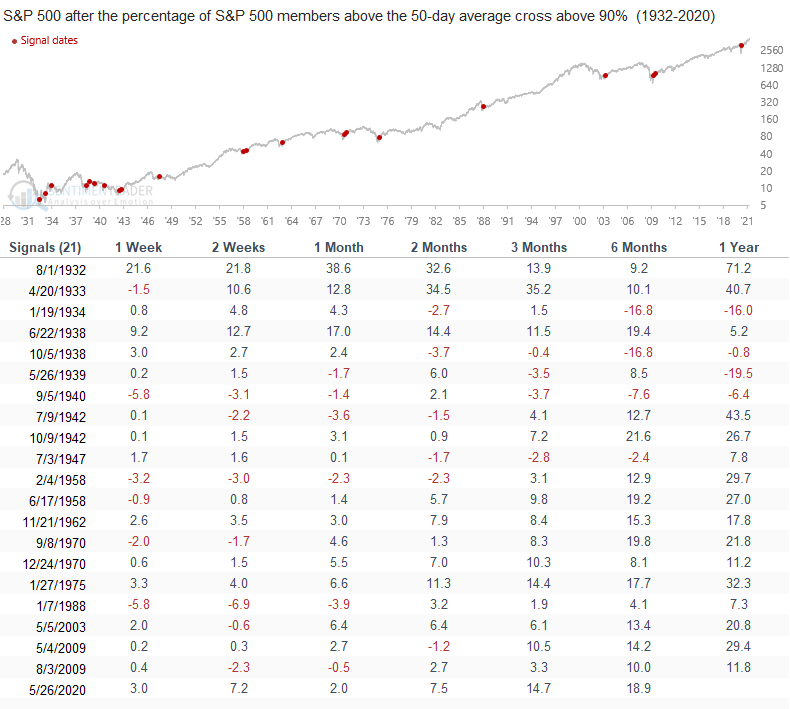
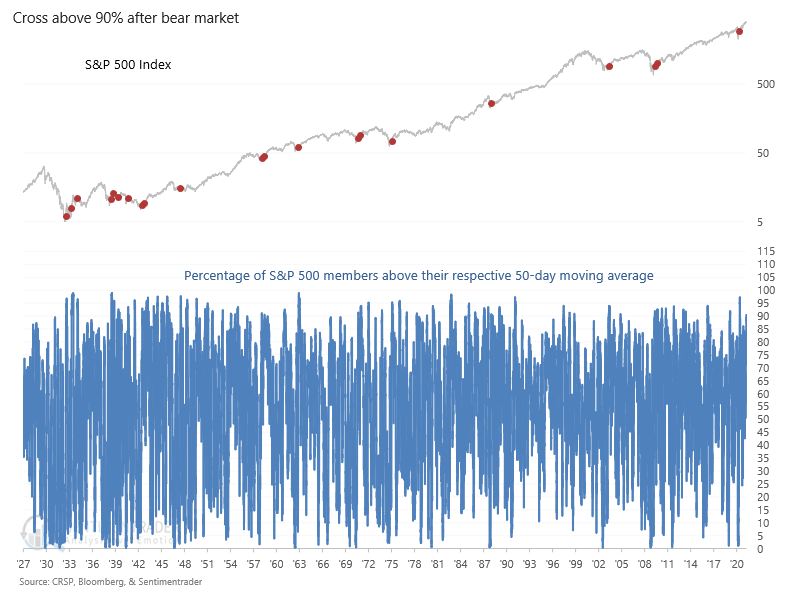 Signal Performance after Bear Market (>20% from Peak)
While short-term performance is good, the results start to pick up in the 3-month timeframe.

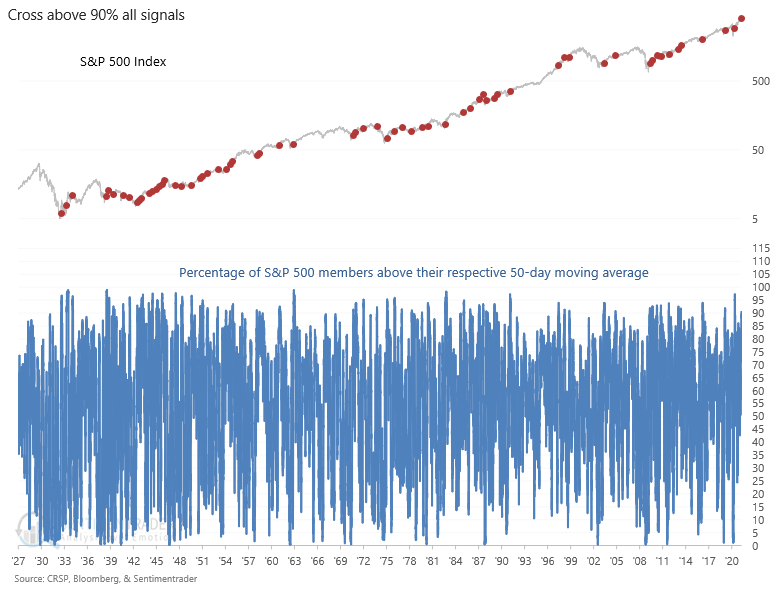
All Signals
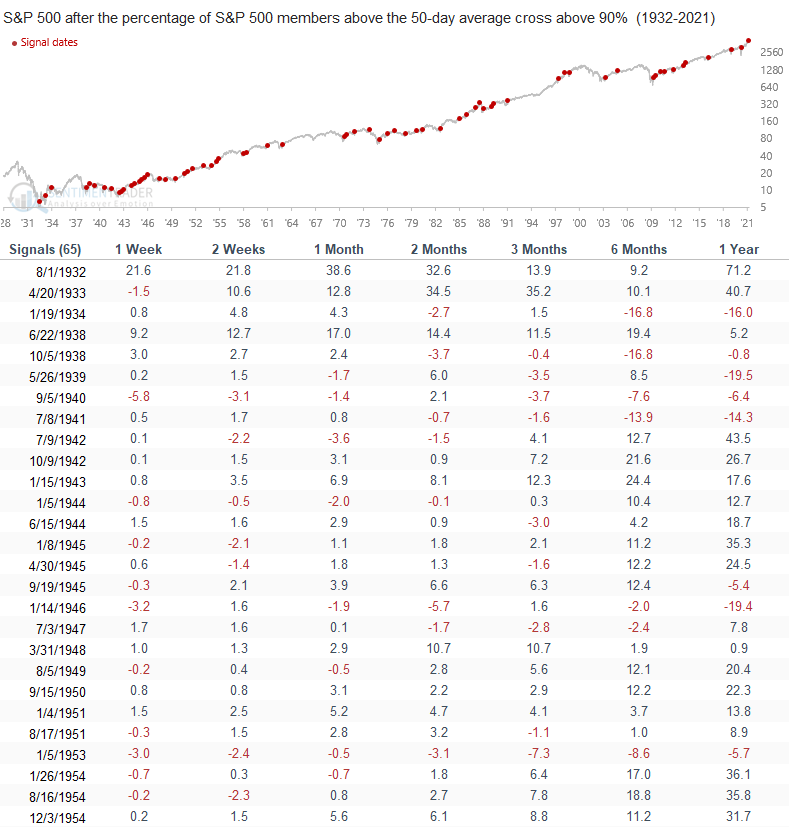
All Signals Performance

Current Day Chart
252-Day High

Correction
 Bear Market

Conclusion: The percentage of members above the 50-day average momentum buy signal is an excellent model even when a signal occurs at a 252-day high. Market participation across several indicators remains strong. Therefore, one must maintain a constructive outlook.

