
Panic/Euphoria Model marks an extreme in investor sentiment

Key points
- The Panic/Euphoria Model measures the mood of investors
- There are different ways to interpret indicator results
- This indicator currently falls firmly on the bullish side of the ledger
The Panic/Euphoria Model
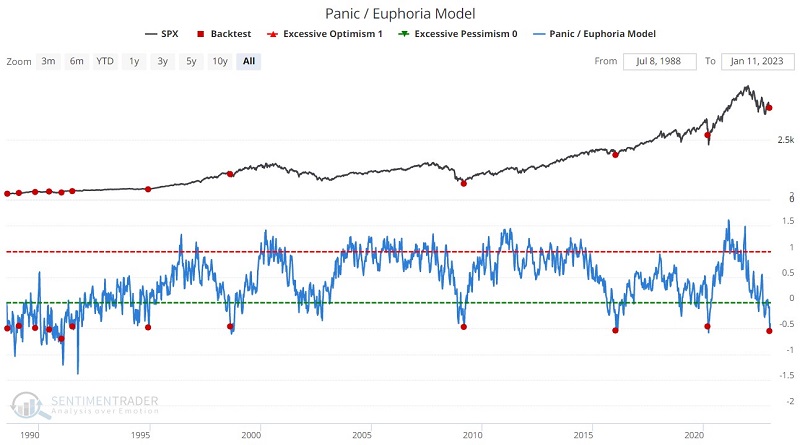
This Sentimentrader Panic/Euphoria Model is based on the Citi Panic / Euphoria model published in Barron's magazine. Our version does not reflect those published values. Instead, our interpretation of the model inputs differs modestly from the published figures. It is comprised of the following primary inputs: NYSE short interest, margin debt, Nasdaq vs. NYSE volume, Investor's Intelligence survey, AAII survey, retail money market funds, put/call ratios, commodities prices, and retail gasoline prices.
The higher the model, the more investors are in a euphoric mood, with lower expected stock returns going forward. Low values, particularly below zero, suggest that investors are extraordinarily gloomy and/or have panicked, and higher forward returns are expected. While there has been a notable lack of outright panic, the current model reading suggests an extreme amount of bearish gloom among investors.
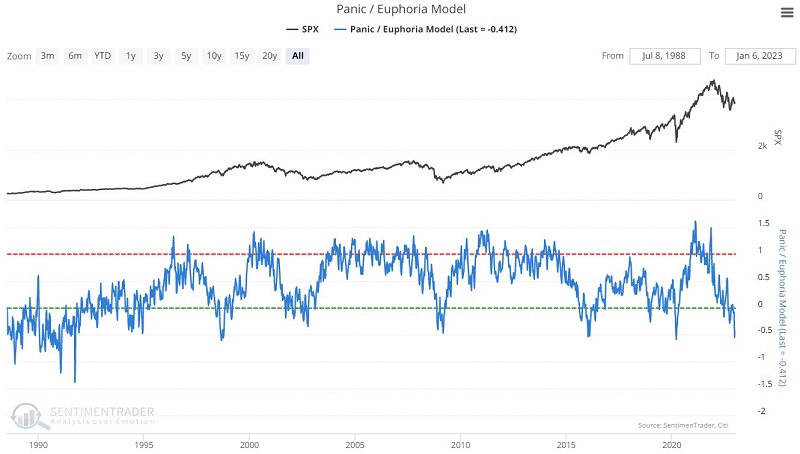
As you can see in the chart above, the indicator swings widely from high to low and back again. Note also that the character of the indicator changed after the early 1990s. During that period, it spent most of its time in what might be considered oversold territory below 0. We will address this a little more as we go.
The most important thing to note about this indicator - and, in fact, many indicators - is that there is not necessarily "one best way" to use it. To illustrate this point, let's consider various ways to interpret Panic/Euphoria Model readings.
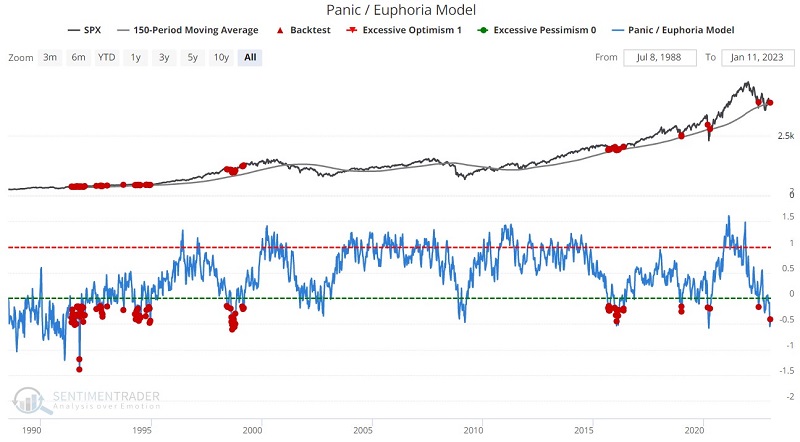
Interpretation #1: Low readings in an uptrend
For our first test, we will use the entire database and highlight any Panic/Euphoria Model reading below -0.15 while the S&P 500 Index is above its 150-day moving average. We are essentially looking for a pullback in an uptrend. The most recent signal occurred on 2023-01-06.
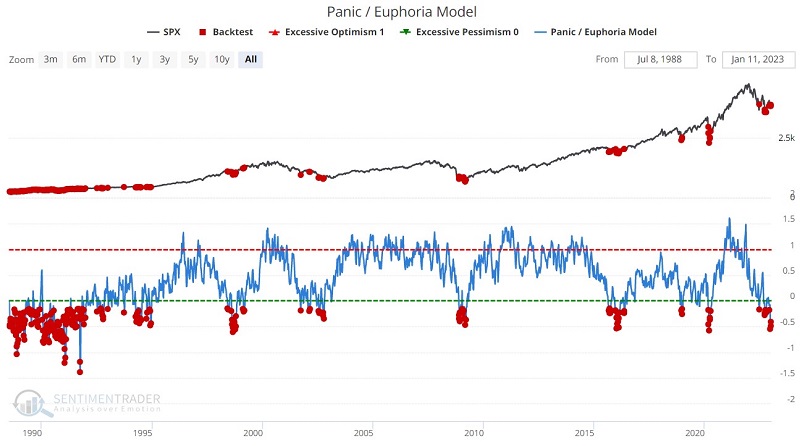
Interpretation #2: Low readings regardless of trend
For our next test, we will again use the entire historical database and highlight any Panic/Euphoria Model reading below -0.15, regardless of whether the S&P 500 Index is above or below its 150-day moving average. In other words, we are considering only the model itself regardless of market price action. The most recent signal occurred on 2023-01-06.
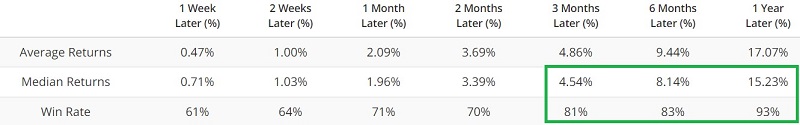
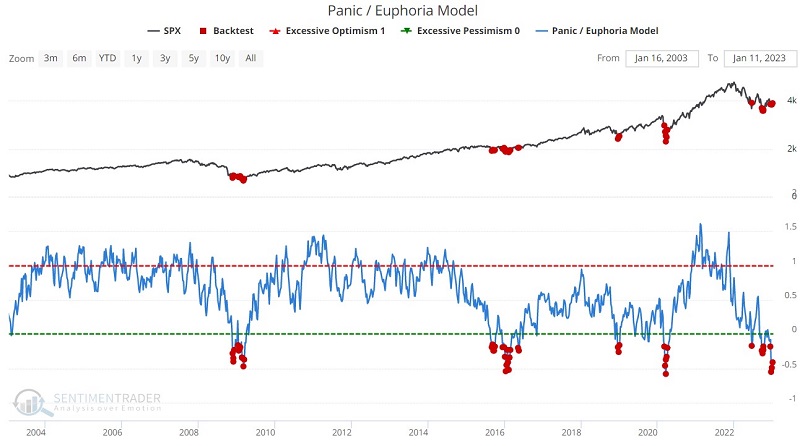
Interpretation #3: Low readings in last 20 years only
As you can see, the iteration above spent most of the early 1990s on a bullish signal. Let's now focus on all readings below -0.15 only on the most recent 20 years of data.
Interpretation #4: Even lower readings in last 20 years
We look for a more extreme reading from the Panic/Euphoria Model for this test. We will highlight all readings below -0.30 only on the most recent 20 years of data.
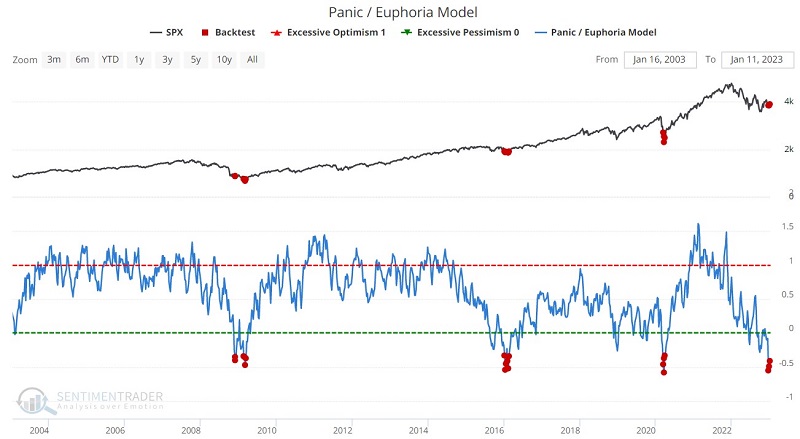
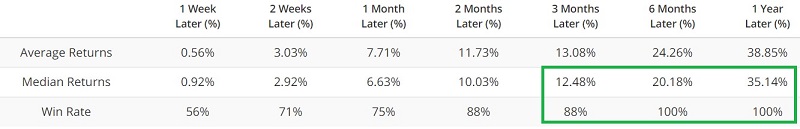
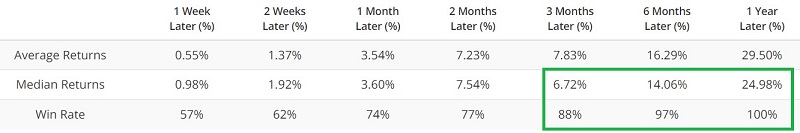
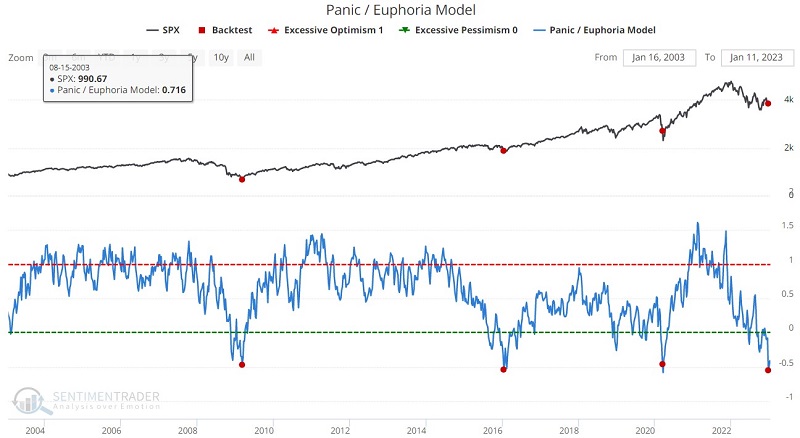
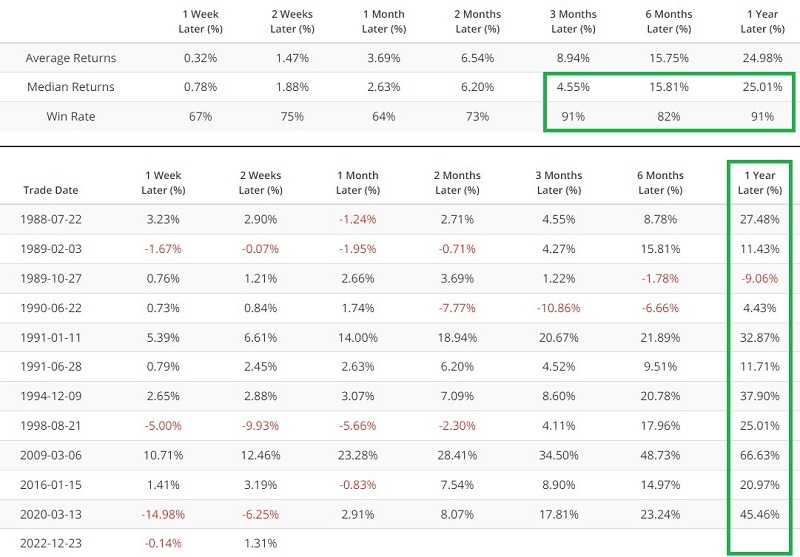
Interpretation #5: Extremely low readings
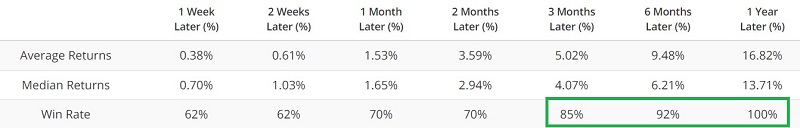
Now let's look at an extreme case. In this test, we look only for days when the Panic/Euphoria Model crossed below -0.45 for the first time in six months. We ignore any signals that occur within six months of a previous signal. The most recent signal occurred on 2022-12-23.
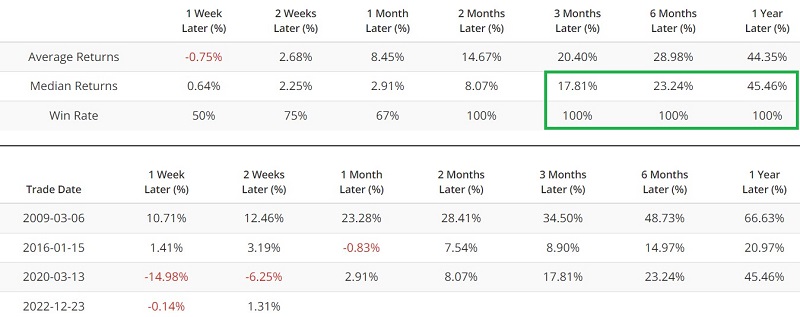
If we extend the test above over the full database history, we get the results below.
What the research tells us…
The Panic/Euphoria Model highlights periods when investors have lost faith in the market and generally serves as a useful contrarian indicator. The question of choosing which criteria to apply is a more complex issue. Focusing only on the most extreme readings can highlight some favorable buying opportunities. On the other hand, less stringent parameters can help to highlight good buying opportunities on a much more frequent basis. However, this can also result in more frequent "false positives."
The Panic/Euphoria Model presently signals an overly bearish extreme in investor sentiment in the here and now. While there is no guarantee, recent action in this indicator suggests favorable results in the year ahead.