
Panic/Euphoria Model is an indicator worth watching

Key Points
- The Panic/Euphoria Model is a valuable measure of extremes in investor sentiment and quite useful on a contrarian basis
- The model is especially useful when combined with price direction and gave a signal in mod-June, which suggests the possibility of a tradable low in the months ahead
- The model is also very valuable when it generates a highly oversold negative reading
The Panic/Euphoria Model
The chart below displays our Panic/Euphoria Model.
This model is based on the Citi Panic / Euphoria model published in Barron's magazine. It does not reflect those published values. Instead, it is our interpretation of the model inputs and construction and differs modestly from the published figures. It is composed of the following primary inputs:
- NYSE short interest
- Margin debt
- Nasdaq vs. NYSE volume
- Investor's Intelligence survey
- AAII survey
- Retail money market funds
- Put/call ratios
- Commodities prices
- Retail gasoline prices
The higher the model, the more investors are in a euphoric mood, with lower expected stock returns going forward. Low values, particularly below zero, suggest investors have panicked, and higher forward returns are expected.
Factoring in Price Trend
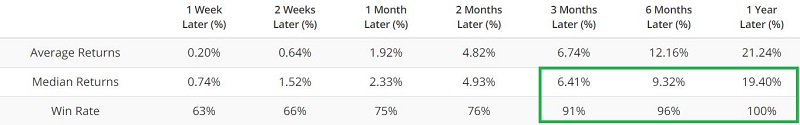
Let's factor in the price trend. The chart below displays those times when the Panic/Euphoria Model was below -0.15, AND the S&P 500 Index was above its 200-week moving average. The table below displays a summary of S&P 500 results following these signals.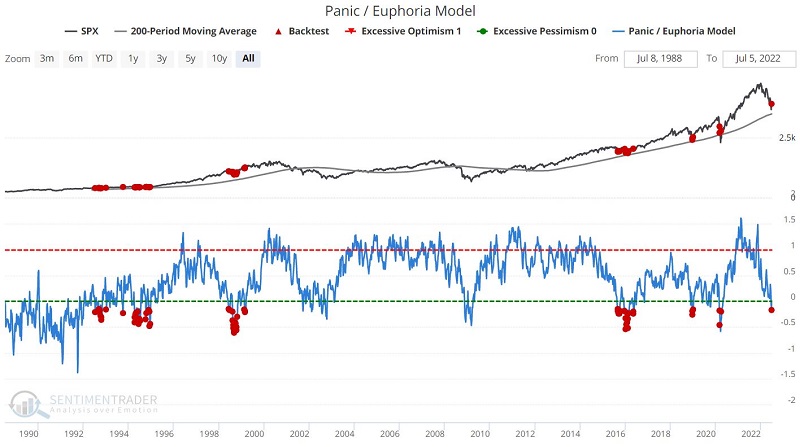
A more extreme situation
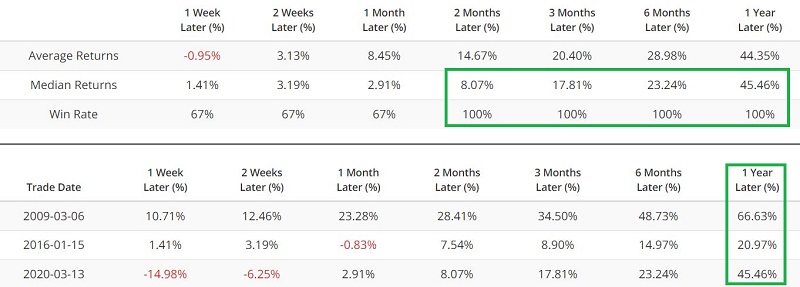
Now let's forget about price and focus solely on highly negative model readings. The chart below displays those times when the Panic/Euphoria Model was below -0.45 (regardless of S&P 500 Index price action). The table below displays a summary of S&P 500 results following these signals.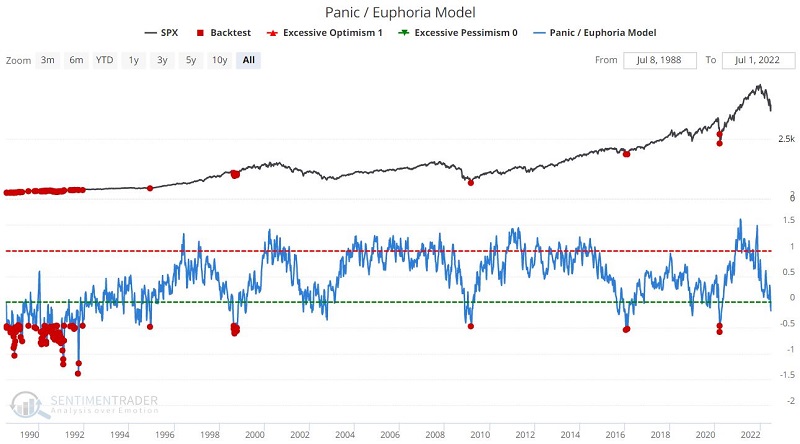
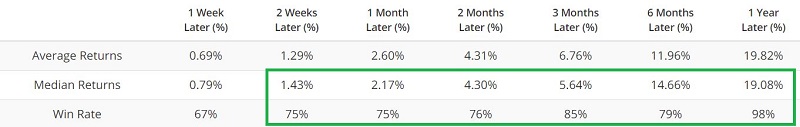
As you can see, the results are heavily skewed by many signals during the 1988-1991 period. Let's take one last slice and look only at those times when the model dropped below -0.45 for the first time in the past 20 years. 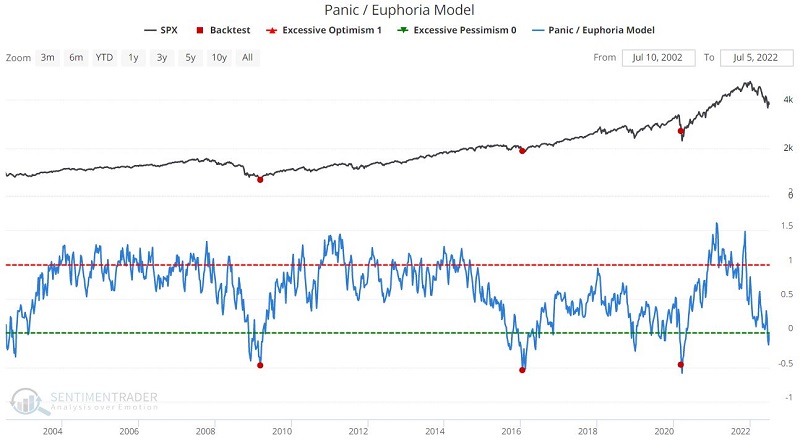
These extreme readings have been rare in recent years, and the model is nowhere close to -0.45. Still, it is worth keeping track of this indicator once a week.
What the research tells us…
The most recent model reading below -0.15 (with SPX above its 200-week MA) occurred on 6/14/2022. As we saw earlier, these signals can sometimes be early, as other bearish factors continue to weigh on the market for several months. But we also saw that six to twelve-month returns tend to be positive following these signals. This suggests that while investors may remain cautious, it is also essential to keep one's eyes (and mind) open to the possibility of a bull market beginning sometime in the months ahead.