Data &
Technology
Research
Reports
Report Solutions
Reports Library
Actionable
Strategies
Free
Resources
Simple Backtest Calculator
Simple Seasonality Calculator
The Kelly Criterion Calculator
Sentiment Geo Map
Public Research Reports
Free Webinar
Pricing
Company
About
Meet Our Team
In the News
Testimonials
Client Success Stories
Contact
Log inLoginSign up
< BACK TO ALL REPORTS

Panic-Level Selling Last Week As Bonds Hit Historic Extreme

Jason Goepfert
2019-08-19
null

Safe haven heaven

Friday provided some relief, but the past few weeks have been rocky for stocks. In response, investors moved aggressively into havens like bonds and gold. The 3-week change in the total return on bonds and gold are so far above that for stocks that it’s neared a 30-year extreme.

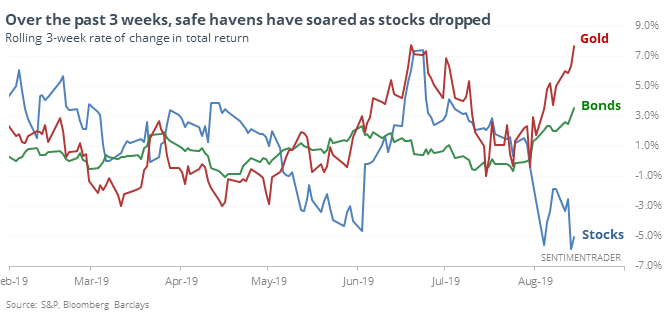
There were really only three distinct time frames in the past 30 years when this happened - January and November 2008, and again in August 2011. If we relax the parameters to get a larger sample size, future returns in stocks were still robust.

Copper comeback?

Large hedgers in copper futures are holding a significant amount of the open interest net long. At the same time, they’re short more than 50% of open interest in gold. The difference between them is wide enough to be considered extreme.

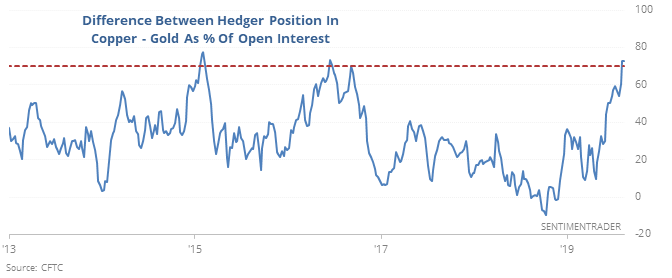
After each of the other times it got this wide over the past 30 years, copper rallied more than gold.

Panic-level selling

The Arms Index (aka TRIN) has shown panic-level selling several times over the past week. The 5-day average climbed above 2 for the first time since August 2011 as a result.

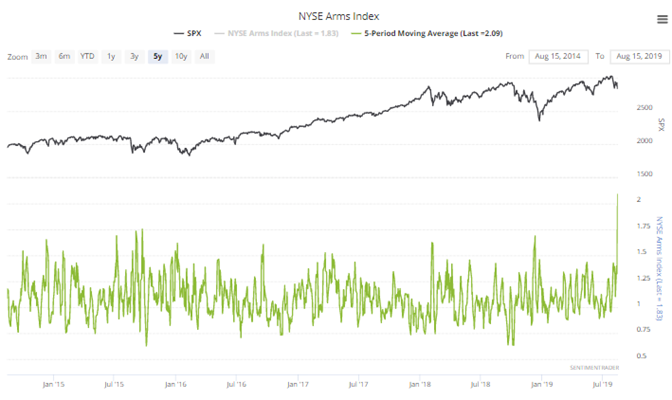
Since 1962, when it starts to calm down, it has been good for stocks. It’s also notable that Up Volume has swung as much to the upside as downside over the past couple of weeks.

Bond Boondogle

A popular technical indicator, the Relative Strength Index, fell to a historic low for bonds last week. Every time it has gotten this low before, bond yields rose over the next few months.

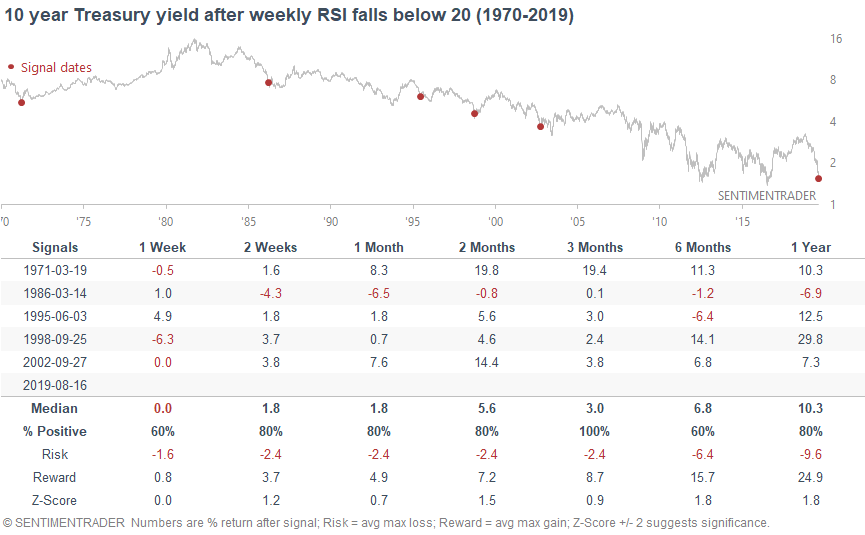
For stocks, it was an excellent sign, with gains in the S&P 500 across almost all time frames past one week for all signals.

The latest Commitments of Traders report was released, covering positions through Tuesday

The 3-Year Min/Max Screen shows new extremes in Eurodollars and natural gas, but neither market has traditionally responded very well to this data. Mostly, hedgers made small adjustments to contracts that were already showing extremes.

This post was an abridged version of our previous day's Daily Report. For full access, sign up for a 30-day free trial now.

DATA &
TECHnologies
IndicatorEdge
‍
BackTestEdge
‍
Other Tools
‍
DataEdge API
RESEARCH
reports
Research Solution
‍
Reports Library
‍
actionable
Strategies
Trading Strategies
‍
Smart Stock Scanner
‍
FREE
RESOUrCES
Simple Backtest
Calculator
Simple Seasonality
Calculator
The Kelly Criterion
Calculator
Sentiment Geo Map
‍
Public Research Reports
‍
Free Webinar
COMPANY
‍
About
‍
Meet our Team
‍
In the News
‍
Testimonials
‍
Client Success Stories
Pricing
Bundle pricing
‍
Announcements
‍
FAQ
© 2024 Sundial Capital Research Inc. All rights reserved.
Setsail Marketing
TermsPrivacyAffiliate Program
Risk Disclosure: Futures and forex trading contains substantial risk and is not for every investor. An investor could potentially lose all or more than the initial investment. Risk capital is money that can be lost without jeopardizing ones’ financial security or life style. Only risk capital should be used for trading and only those with sufficient risk capital should consider trading. Past performance is not necessarily indicative of future results.

Hypothetical Performance Disclosure: Hypothetical performance results have many inherent limitations, some of which are described below. No representation is being made that any account will or is likely to achieve profits or losses similar to those shown; in fact, there are frequently sharp differences between hypothetical performance results and the actual results subsequently achieved by any particular trading program. One of the limitations of hypothetical performance results is that they are generally prepared with the benefit of hindsight. In addition, hypothetical trading does not involve financial risk, and no hypothetical trading record can completely account for the impact of financial risk of actual trading. for example, the ability to withstand losses or to adhere to a particular trading program in spite of trading losses are material points which can also adversely affect actual trading results. There are numerous other factors related to the markets in general or to the implementation of any specific trading program which cannot be fully accounted for in the preparation of hypothetical performance results and all which can adversely affect trading results.

Testimonial Disclosure: Testimonials appearing on this website may not be representative of other clients or customers and is not a guarantee of future performance or success.