
Options updates - TSLA, TLT, XBI and SLV

Key Points
- In many ways, entering an options trade is the easy part
- Slightly more complex is planning how to manage the trade (i.e., deciding what criteria will cause you to exit with a profit - or to exit with a loss)
- Harder still (sometimes) is pulling the trigger when the time comes - or making an adjustment on the fly based on new developments
- Recent option trade examples involve TSLA, TLT, XBI, and SLV
TSLA short naked put
This article on 6/17 highlighted an example trade using the cash secured put strategy with TSLA. With TSLA trading at $629.75 a share, the trade involved:
- Selling 1 TSLA Sep16 2022 400 put @ $24.65
The initial position appears in the figure below (all figures below are courtesy of Optionsanalysis).
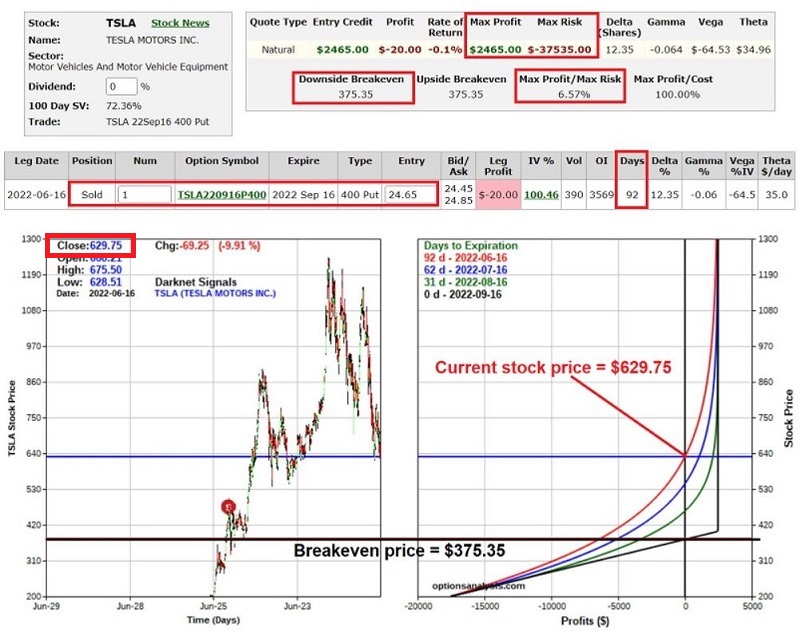
The trade required a cash position of $37,535 (to cover the cost of buying 100 shares of TSLA if the put was exercised) and profit potential of 6.6% in 92 days.
Since then:
TSLA shares have advanced from $629.75 to $891.83. The put option has declined in price from $24.65 to $1.34. This represents an open profit of $2,331, or 6.2%, in 46 days.
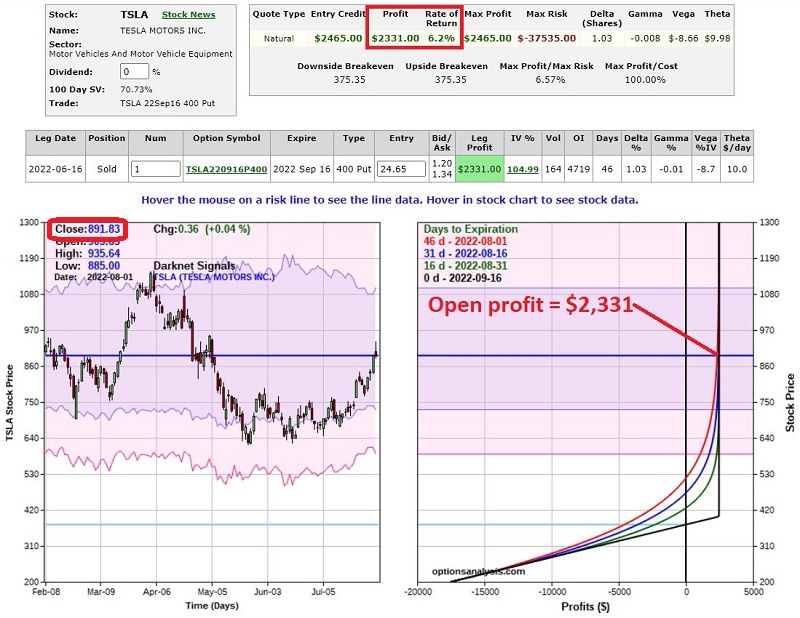
At this point, the choices are a) take a profit or b) wait for September options expiration in hopes that the option will expire worthless. At this point, the remaining profit potential is only an additional $124. I would be inclined to buy back the put, close the trade, take a profit and release the $37,535 cash to use elsewhere.
TLT bull call spread
This article on 6/23 highlighted an example trade using the bull call spread strategy with TLT. With TLT trading at $113.21 a share, the trade involved:
- Buying 3 TLT Aug19 2022 116 calls @ $2.64
- Selling 3 TLT Aug19 2022 131 calls @ $0.31
The initial position appears in the figure below.
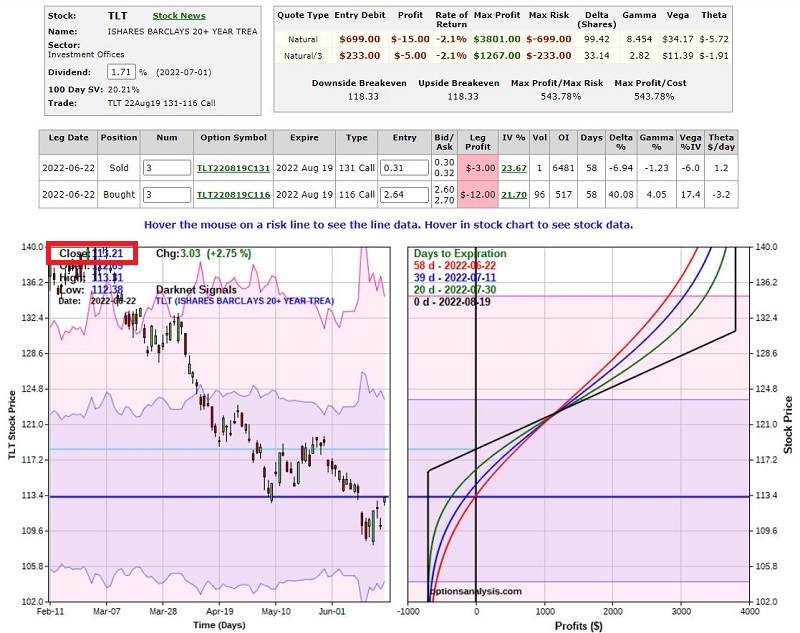
The trade cost $699 to enter (also the maximum risk), with a profit potential of $3,801.
Since then:
TLT shares have advanced from $113.21 to $120.04. The option trade has an open profit of $645, or 92% in 40 days.
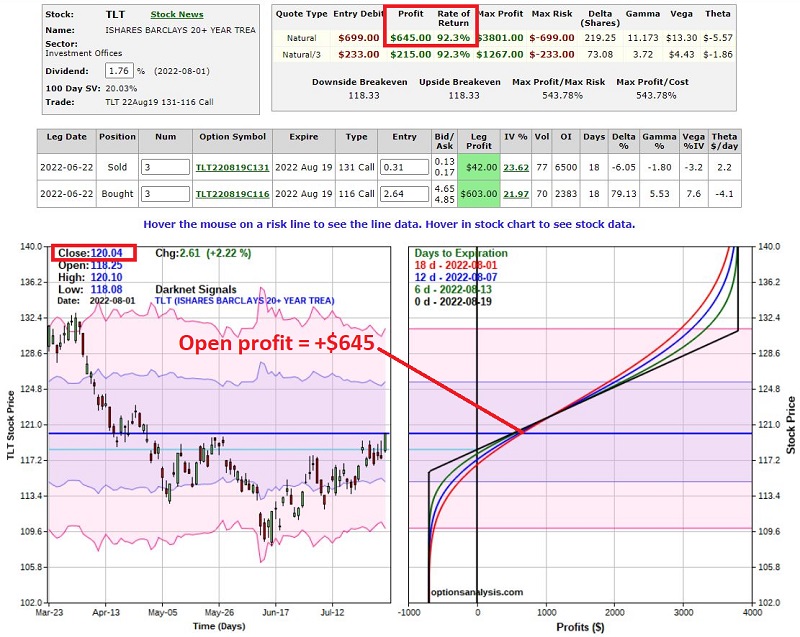
At this point, the choices are a) take a profit, b) let it ride, or c) adjust the position. The critical thing to remember is that there are no "correct" answers, only choices to be made. The original article suggested taking a profit if that profit neared 100%. So, taking a profit here might make sense. At the same time, based on a subsequent bullish on bonds article, a trader might be inclined to play for still higher bond prices. The problem is that "letting it ride" involves risking giving back a 92% open profit - which can be financially painful and psychologically crippling for some time (i.e., it can lead to A LOT of second-guessing in the future).
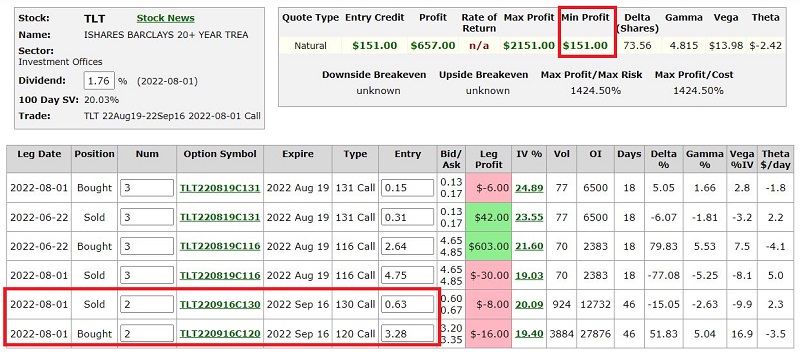
So, let's consider "adjusting" the trade. One possibility is replacing one bull call spread with another bull call spread:
- Sell 3 TLT Aug19 2022 116 calls @ $4.75
- Buy 3 TLT Aug19 2022 131 calls @ $0.15
- Buy 2 TLT Sep16 2022 120 calls @ $3.28
- Sell 2 TLT Sep16 2022 130 calls @ $0.63
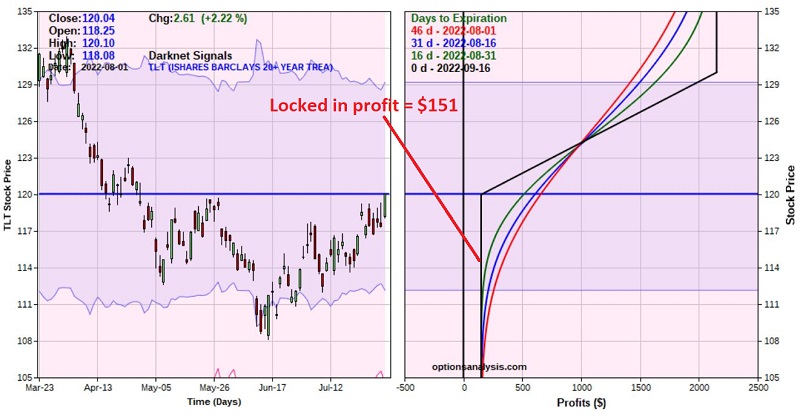
The net effect is that we lock in a worst-case profit of $151 and retain the potential for more upside profit. The figure below displays the particulars, and the chart below displays the risk curves for the adjusted trade. Note that after the adjustment, there is no chance that the trade can end up as a losing trade.
XBI long call
Based on this article on 5/11 and Dean's article on 6/28, this article on 6/29 highlighted an example trade using the stock replacement strategy (i.e., long a deep-in-the-money call option) with XBI. With XBI trading at $74.06 a share, the trade involved:
- Buying 1 XBI Sep16 2022 60 call @ $16.30
The initial position appears in the figure below.
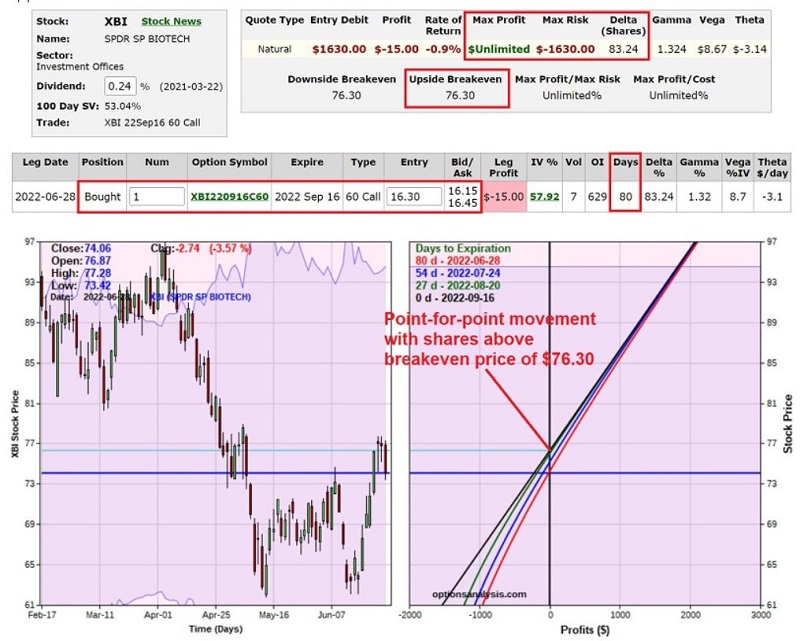
The trade cost $1,630 to enter (also the maximum risk), with unlimited profit potential.
Since then:
XBI shares rallied above $86 before slumping back to $79.47. The trade has an open profit of $335, or 21% in 34 days.
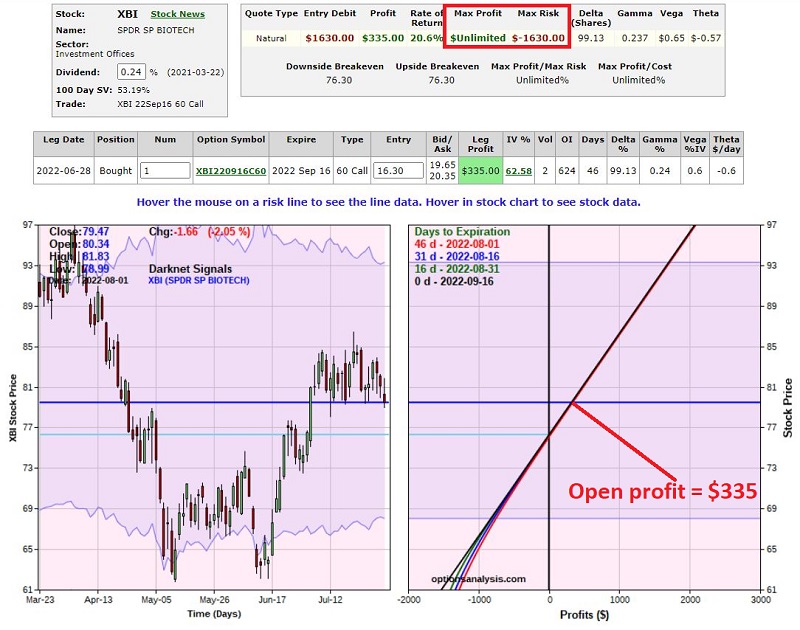
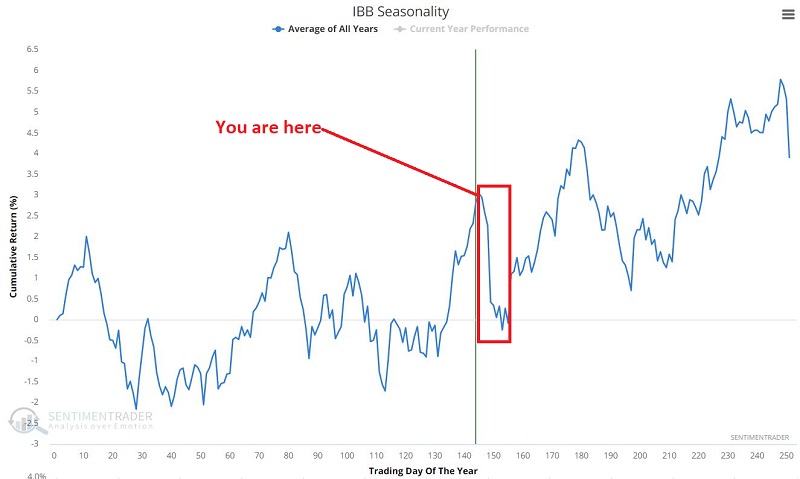
As you can see in the chart below, biotech seasonality is about to peak. Based on the potential for weakness in the sector, I would be inclined to take a profit on the option position and move on.
SLV long call
This article on 7/15 highlighted an example trade using the long call strategy with SLV. With SLV trading at $17.00 a share, the trade involved:
- Buying 1 SLV Sep16 2022 15 call @ $2.26
The initial position appears in the figure below.
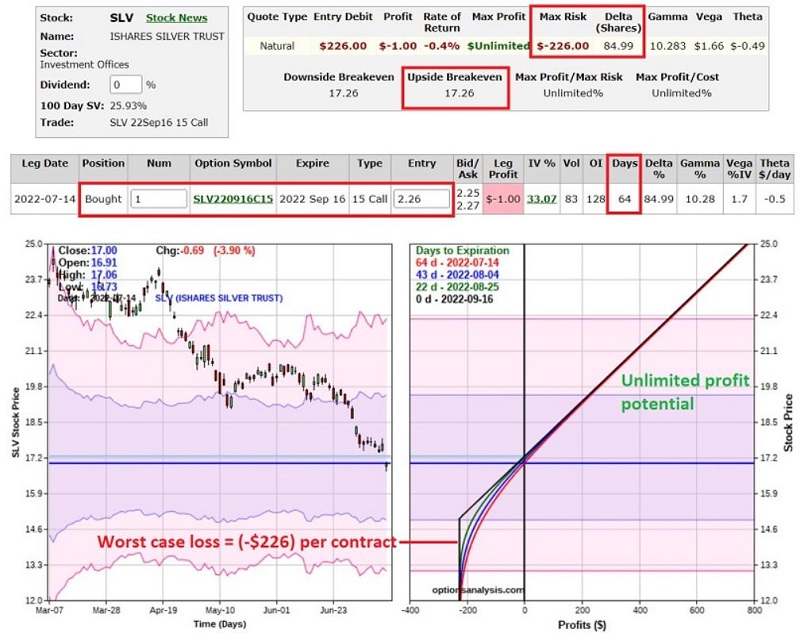
The trade cost $226 to enter (also the maximum risk), with unlimited profit potential.
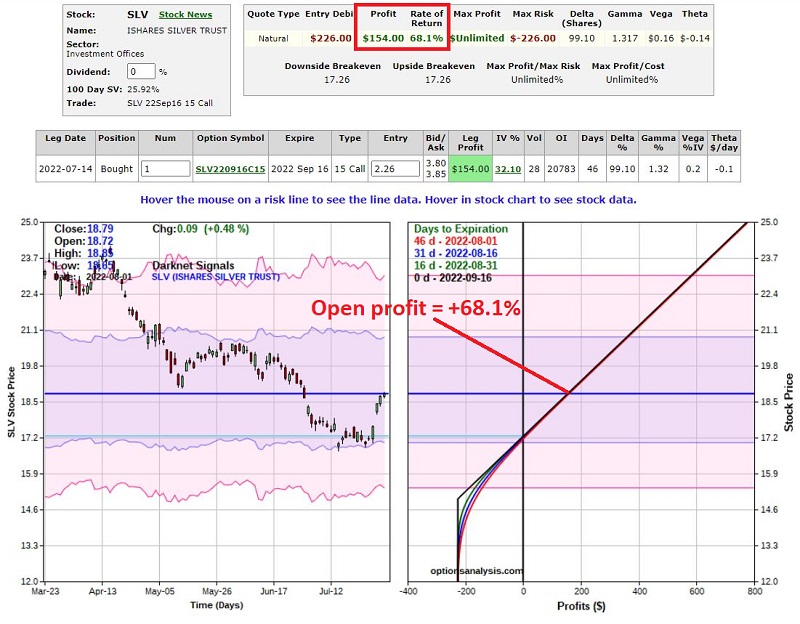
Since then:
SLV shares have advanced to $18.79 and the call option to $3.80. The trade has an open profit of $154, or 68% in 18 days. After a powerful five-day advance, it may be tempting to take a profit. On the other hand, the rally may have further to go. Each trader must decide what to do - or not do - at this point.
What the research tells us…
Trading stocks involves deciding when to buy and when to sell. Trading options can be very different. There is deciding what to trade, when to trade, which strategy to use and which specific option strike price, and months to trade. Then there is deciding when to take a profit, cut a loss, and - to make it interesting - contemplating situations when "adjusting" a current position might make sense. Hopefully, the examples of trades and adjustments detailed above will shed some light on the process.