Data &
Technology
Research
Reports
Report Solutions
Reports Library
Actionable
Strategies
Free
Resources
Simple Backtest Calculator
Simple Seasonality Calculator
The Kelly Criterion Calculator
Sentiment Geo Map
Public Research Reports
Free Webinar
Pricing
Company
About
Meet Our Team
In the News
Testimonials
Client Success Stories
Contact
Log inLoginSign up
< BACK TO ALL REPORTS

Options: Understanding What You are Getting Into (Part 2)

Jay Kaeppel
2021-02-18
An apples-to-apples comparison of 25-delta stock and option positions

This is Part II of an ongoing series highlighting the relative pros and cons of various approaches to trading options.

In Part I of this series, I highlighted the difference between buying 100 shares of SPY and buying a call option on SPY with a delta of 25. In this short piece we will do more of an apples-to-apples comparison to highlight the reward/risk differences between buying an out-of-the-money call option and buying shares of the underlying security.

In this piece instead of comparing a 25-delta call option to 100 shares of stock we will compare the following two positions:

  • Long one SPY 25-delta call option
  • Long 25 shares of SPY

Both of these positions start with a delta of 25. 

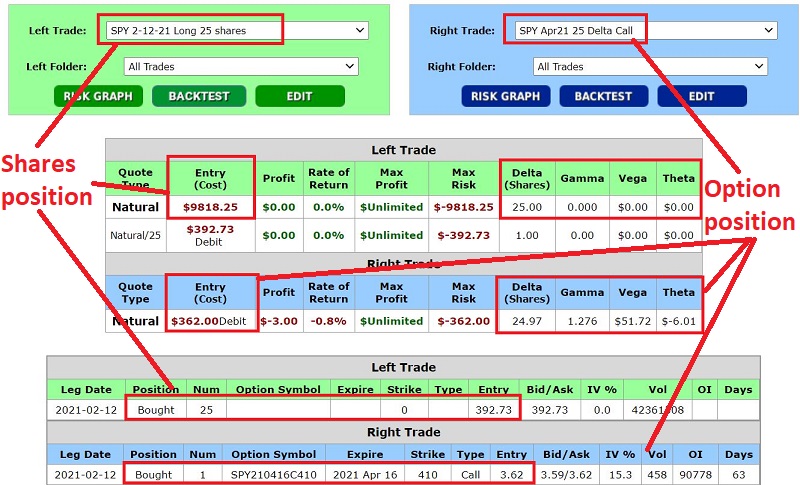
  • To buy 25 shares of SPY at $392.73 a share costs $9,818.25
  • To buy one SPY Apr16 410 call option at $3.62 costs $362

The particulars of the two positions appear below.

The charts below display the risk curves for the two-position overlaid atop one another. 

  • The risk curve for the stock position is the black straight line
  • The risk curves for the option position are the orange curved line and the grey line that resembles a hockey stick

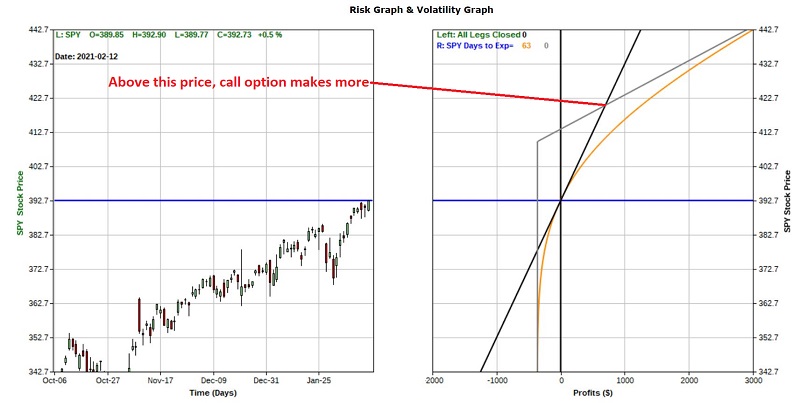
The tradeoffs are fairly easy to grasp:

  • The option position costs far less to enter ($362 for one call option versus $9,818 for 25 shares of an ETF)
  • Above a certain price the call option has greater profit potential
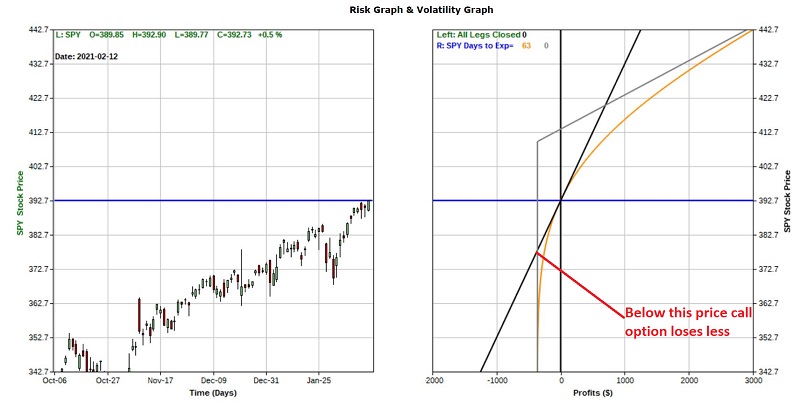
  • Below a certain price the call option has less downside risk
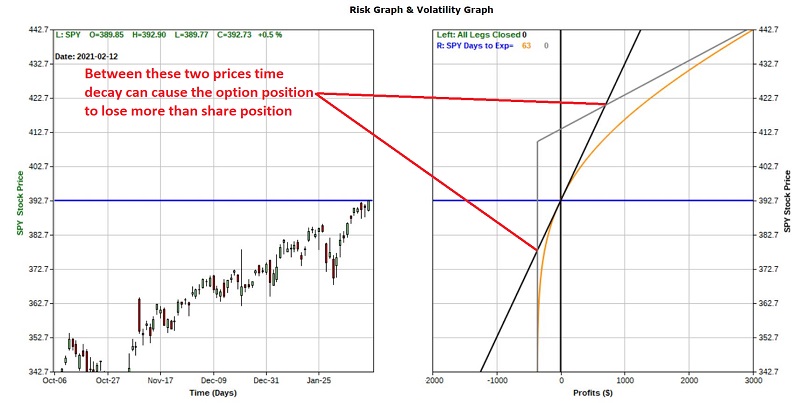
  • Between those two prices the call option has a greater potential for loss (this is due to time decay as the time value built into the price of the option drops to zero by option expiration)

The question on most people's mind is "which position is better?" The answer to that question is in the eye of the beholder. Among the primary considerations when attempting to answer that question might be:

How confident are you that SPY will make the necessary price move prior to option expiration?

If you are highly confident that a significant price advance is imminent then the call option affords you the potential to maximize your profitability. 

How long do you want to have exposure to SPY?

If your answer is "longer than 63 days" or even "possibly longer than 63 days" then this particular long call position may not make sense as it will cease to exist in 63 days.

In succinct terms:

  • the shares position is a bet on higher prices at some point in time
  • the option position is a bet on higher prices sooner than later

Assessing your own objectives and expectations is the key to choosing the proper position.

Sorry, you don't have access to this report

Upgrade your subscription plan to get access
Go to Dasboard
DATA &
TECHnologies
IndicatorEdge
‍
BackTestEdge
‍
Other Tools
‍
DataEdge API
RESEARCH
reports
Research Solution
‍
Reports Library
‍
actionable
Strategies
Trading Strategies
‍
Smart Stock Scanner
‍
FREE
RESOUrCES
Simple Backtest
Calculator
Simple Seasonality
Calculator
The Kelly Criterion
Calculator
Sentiment Geo Map
‍
Public Research Reports
‍
Free Webinar
COMPANY
‍
About
‍
Meet our Team
‍
In the News
‍
Testimonials
‍
Client Success Stories
Pricing
Bundle pricing
‍
Announcements
‍
FAQ
© 2024 Sundial Capital Research Inc. All rights reserved.
Setsail Marketing
TermsPrivacyAffiliate Program
Risk Disclosure: Futures and forex trading contains substantial risk and is not for every investor. An investor could potentially lose all or more than the initial investment. Risk capital is money that can be lost without jeopardizing ones’ financial security or life style. Only risk capital should be used for trading and only those with sufficient risk capital should consider trading. Past performance is not necessarily indicative of future results.

Hypothetical Performance Disclosure: Hypothetical performance results have many inherent limitations, some of which are described below. No representation is being made that any account will or is likely to achieve profits or losses similar to those shown; in fact, there are frequently sharp differences between hypothetical performance results and the actual results subsequently achieved by any particular trading program. One of the limitations of hypothetical performance results is that they are generally prepared with the benefit of hindsight. In addition, hypothetical trading does not involve financial risk, and no hypothetical trading record can completely account for the impact of financial risk of actual trading. for example, the ability to withstand losses or to adhere to a particular trading program in spite of trading losses are material points which can also adversely affect actual trading results. There are numerous other factors related to the markets in general or to the implementation of any specific trading program which cannot be fully accounted for in the preparation of hypothetical performance results and all which can adversely affect trading results.

Testimonial Disclosure: Testimonials appearing on this website may not be representative of other clients or customers and is not a guarantee of future performance or success.