Data &
Technology
Research
Reports
Report Solutions
Reports Library
Actionable
Strategies
Free
Resources
Simple Backtest Calculator
Simple Seasonality Calculator
The Kelly Criterion Calculator
Sentiment Geo Map
Public Research Reports
Free Webinar
Pricing
Company
About
Meet Our Team
In the News
Testimonials
Client Success Stories
Contact
Log inLoginSign up
< BACK TO ALL REPORTS

Options traders spend billions betting that this rally won't end

Jason Goepfert
2020-02-19
Each of the past two weeks, options traders have spent at least $7 billion in bets on a rally. The Nasdaq's correlation to 1999 isn't exclusive.

6 weeks of speculation

Since early January, options traders have been aggressively betting on a continued ramp higher in stocks. It’s mostly paid off, and they keep pressing. Each week that goes by without a pullback, traders become more aggressive, and by some measures, they’ve never been more exposed.

They’ve been spending heavily on that opinion. With the surge in call buying, their total outlay has exceeded more than $7 billion in premiums paid each of the last two weeks. That’s far beyond anything we’ve seen in the past 20 years. Over the past 5 years, it's almost double the previous record.

Total premiums on call options

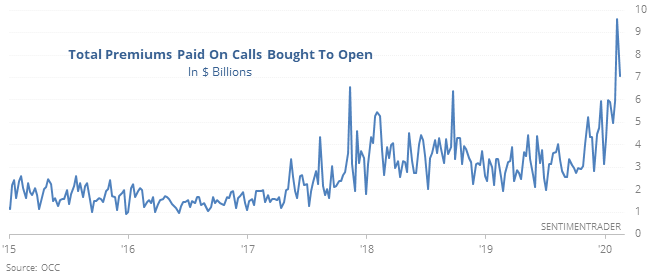
In a market that’s enjoyed a couple months of “nothing matters,” it’s hard to imagine that this kind of speculative activity won’t be punished. The exact timing is never certain, but in markets, when it gets this rewarding to be this carefree, a punishment almost always follows.


Tech rally

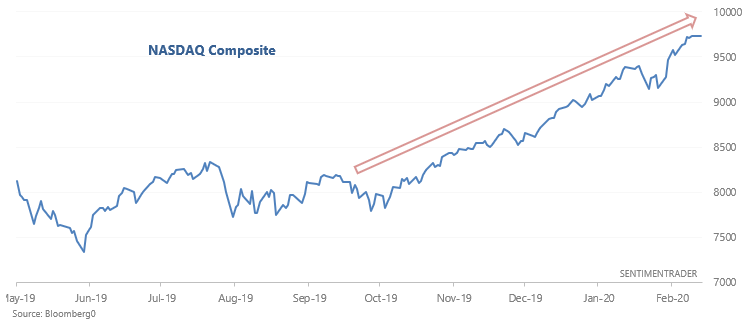
Without a shadow of a doubt, the stock market's rally has been driven by tech. The NASDAQ Composite, NASDAQ 100, and S&P 500 tech sector have surged since October, prompting bears to compare today vs. historical melt-ups that were followed by crashes (e.g. "today is just like 1999").

Nasdaq Composite index

But the problem with overlapping 2 charts on top of each other is that you tend to see what you want to see.

If you're bearish, you're always going to "spot" the similarities between today vs. 1999. So in the interest of bias-free analysis, let's compare the NASDAQ Composite's rally over the past 100 days against other historical 100 day periods, and look at cases in which the correlation exceeded 0.95.

The 1999-2000 period was an extreme case. Looking at all the historical cases which were similar to today, the NASDAQ Composite's returns over the next 2 weeks were poor, but there were more signals that led to gains than losses, especially dramatic ones.

Nasdaq comparisons to 1999 bubble

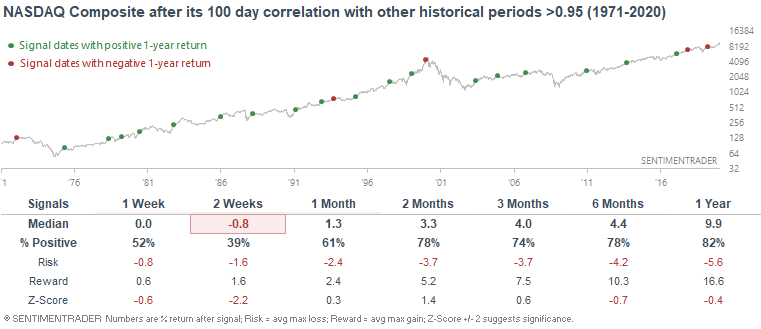
The S&P 500's returns over the next 2 weeks were poor as well, and its average return across almost all time frames was below a random return.

This is an abridged version of our recent reports and notes. For immediate access with no obligation, sign up for a 30-day free trial now.

We also looked at:

  • Other looks at the breathtaking speculation among options traders
  • What happens when low volatility stocks take over from high beta ones
  • YTD, everything is rallying - what happens to the dollar and gold
  • Utilities are overbought on a weekly time frame
  • The dollar has had a heck of a run over the past 11 days
DATA &
TECHnologies
IndicatorEdge
‍
BackTestEdge
‍
Other Tools
‍
DataEdge API
RESEARCH
reports
Research Solution
‍
Reports Library
‍
actionable
Strategies
Trading Strategies
‍
Smart Stock Scanner
‍
FREE
RESOUrCES
Simple Backtest
Calculator
Simple Seasonality
Calculator
The Kelly Criterion
Calculator
Sentiment Geo Map
‍
Public Research Reports
‍
Free Webinar
COMPANY
‍
About
‍
Meet our Team
‍
In the News
‍
Testimonials
‍
Client Success Stories
Pricing
Bundle pricing
‍
Announcements
‍
FAQ
© 2024 Sundial Capital Research Inc. All rights reserved.
Setsail Marketing
TermsPrivacyAffiliate Program
Risk Disclosure: Futures and forex trading contains substantial risk and is not for every investor. An investor could potentially lose all or more than the initial investment. Risk capital is money that can be lost without jeopardizing ones’ financial security or life style. Only risk capital should be used for trading and only those with sufficient risk capital should consider trading. Past performance is not necessarily indicative of future results.

Hypothetical Performance Disclosure: Hypothetical performance results have many inherent limitations, some of which are described below. No representation is being made that any account will or is likely to achieve profits or losses similar to those shown; in fact, there are frequently sharp differences between hypothetical performance results and the actual results subsequently achieved by any particular trading program. One of the limitations of hypothetical performance results is that they are generally prepared with the benefit of hindsight. In addition, hypothetical trading does not involve financial risk, and no hypothetical trading record can completely account for the impact of financial risk of actual trading. for example, the ability to withstand losses or to adhere to a particular trading program in spite of trading losses are material points which can also adversely affect actual trading results. There are numerous other factors related to the markets in general or to the implementation of any specific trading program which cannot be fully accounted for in the preparation of hypothetical performance results and all which can adversely affect trading results.

Testimonial Disclosure: Testimonials appearing on this website may not be representative of other clients or customers and is not a guarantee of future performance or success.