
Options Gone Wild - The Gamestop Edition


Jason has done yeoman's work in highlighted the shocking amount of rampant speculation going on in the options market. Numerous stocks have "gone vertical" and options trading on many of them is through the roof. Case in point is GameStop (ticker GME). In July 2020 the stock was trading under $4 a share. Then came the rally, then came the short-selling, then came the short squeeze and on 1/25/21 GME opened at near $97 shot up to $159 and then closed under $77. As I write the stock is back up near $90 a share.
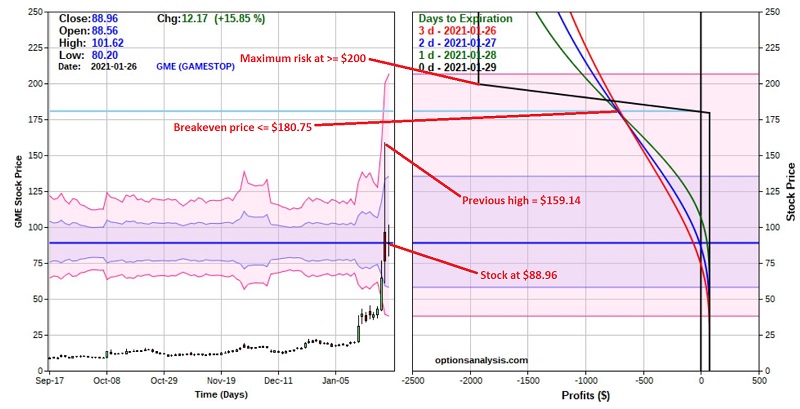
Option market makers have jacked implied volatilities and thus time premiums for options on GME to astronomical levels. The chart below displays a 4-year bar chart along with the implied volatility for at-the-money options with 7-30 days left until expiration historically. Prior to the current explosion the highest high was in the 275% range. As you can see at the far right of the chart IV's for GME options are now over 500%! This simply tells us that the amount of time premium built into the price of GME options is far greater than at any time in the past four years.
All charts and Figures courtesy of www.OptionsAnalysis.com
The good news is that high option volatility means potential opportunities for option sellers. The bad news is:
- Risk is high
- Wide bid/ask spreads can be a large issue
What follows is an example only and NOT a "recommendation." The purpose of the example is simply to illustrate one way (out of many ways) to play. In fact, as quickly as GME is moving, the prices for this example trade may be significantly different than the one's you see here.
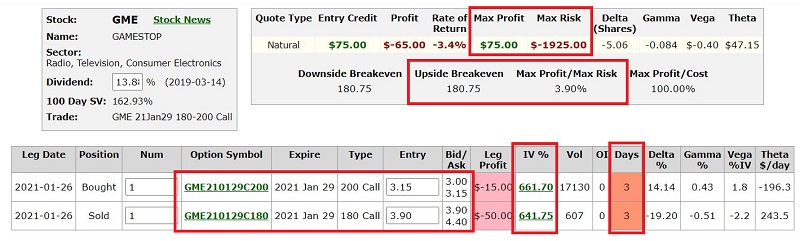
As I write, GME is trading at $88.11. The high from the previous day's "spike" was $159.14. The example trade involves:
- Selling 1 Jan29 180 call @ $3.90
- Buying 1 Jan 29 200 call @ $3.15
NOTE: As quickly as GME is changing in price, by the time you read this these prices may be completely out-of-date. But remember this is intended only to an example of one type of trading opportunity that can become available if and when option IV soars.
Please note that the prices used are the prices you would get if you enter a "market" order. This is NOT recommended. Ideally you would enter a "limit" order and try to trade closer to the midpoint of the bid/ask spread for each option. Note in the figure below that the bid/ask spread for the 180 call is a whopping $0.50 (3.90 bid/4.40 ask). When things get "crazy" market makers attempt to widen bid/ask spreads in order to help manage their own risk. For simplicity in this example we will simply use market order prices.
The trade particulars are displayed in the figure below and the risk curves appear in the chart below that.
 Things to Note:
- There are only 3 more trading days (after today) left until these options expire
- If entered as a market order this trade has a profit potential of $75 (3.90%) and a maximum risk of $1,925
- The maximum risk will only be realized if GME stock is trading at or above $200 by Friday's close
- The breakeven price on the trade is $180.75
- Note the IV's for these options - 662% and 642% respectively - previously unheard-of levels
What to expect:
- This trade will make money as long as GME stock remains below $180 a share by the close on Friday
Will GME stay below $180 until the end of the week? Or will GME experience another massive short squeeze and "explode" again. Is this an "easy $75?" Or are you stepping in front of an oncoming train? Your answer to these questions will determine your attitude towards this type of trade. In addition, note that it takes a certain mindset to risk $1,925 for the chance of making $75. You might also take note that at least one analyst is calling for GME to trade in the thousands.
The bottom line on this example trade: Selling options is a game of probability plus reward versus risk. If you are confident in your belief that GME will NOT trade above $180 a share by Friday of this week AND you are willing to risk $1,925 to make $75, you stand to make 3.90% in 3 days. If the short squeeze continues you stand to get hit hard and fast.