
Options 101: Understanding the Stock Replacement Strategy

It seems like it should go without saying, but it doesn't always. So, let's spell it out: One of the keys to success in option trading is understanding exactly what you are (and just as importantly, are not) getting into when you enter a trade.
Options offer a great deal of flexibility and opportunity, with any number of strategies available to take advantage of any particular market outlook or investment objective. The irony is that the Good News about option trading is exactly the same as the Bad News about option trading as clearly stated in:
Jay's Trading Maxim #115: The greatest thing about trading options ("there are so many possibilities") is also – ironically – the very worst thing about trading options ("there are so many possibilities").
So, let's look at just one specific strategy and spell out exactly what it is designed to accomplish
The Stock Replacement Strategy
The purpose of this strategy is captured in the name – instead of buying shares of stock a trader buys a call option (technically, a bearish trader could buy a put option instead of selling short shares of stock as well. But conceptually, it is much easier to grasp by looking at the long side). Let's illustrate this with an example. As always, the trade example I am going to use is just that – an example – and NOT a "recommendation."
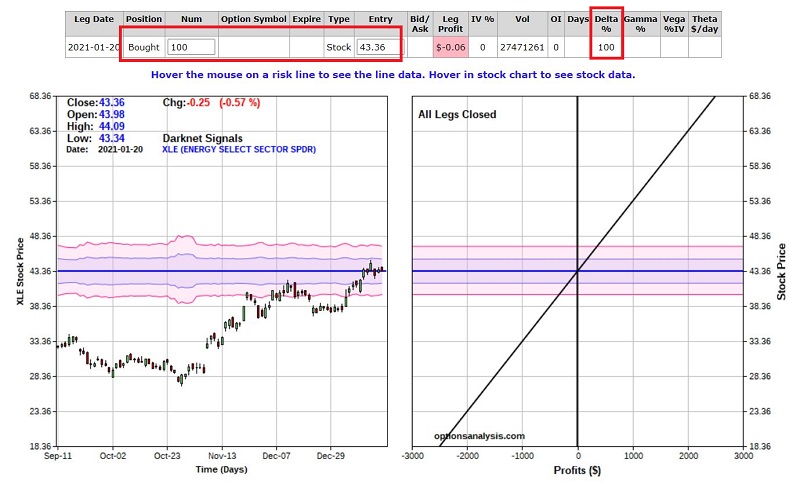
The energy sector has finally started to bounce back from its long downward trend of late. So, let's suppose a trader believes that the energy sector as a whole will advance between now and the end of April. The most straightforward approach would be to buy 100 shares of stock. As I write ticker XLE (SDPR Energy ETF) is trading at $43.36 a share. So, to buy 100 shares of XLE a trader would put up $4,336. The risk "curve" for this position would be a straight line as seen in the chart below. For every point XLE rises the position gains $100 and for every point XLE declines the position loses $100 (hence the straight line). All figures below are courtesy of www.Optionsanalysis.com.
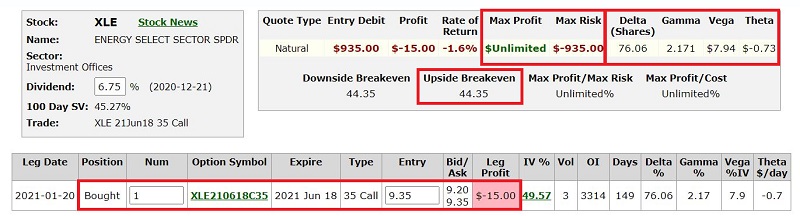
Now let's consider a "stock replacement" position. The trader expects a move by the end of April. April XLE options expire on April 16, so the next available expiration month is June. For the purposes of this strategy, we want to look for an in-the-money call option with a reasonable bid/ask spread. We settle on the June 35 call option trading at $9.20 bid/$9.35 ask. For the sake of illustration, we will simply assume that the trader uses a market order and pays the "ask" price of $9.35, for an entry cost of $935 (in real-world trading it would normally be suggested to place a "limit" order closer to the midpoint of the range – say $9.28 – in order to try to get a better fill. If the limit order is not filled near the end of the day the trader might consider cancelling that order and going ahead with a market order in order to make sure the position gets established). The particulars for this trade appear below.
There are a variety of things to note:
- The cost of the trade ($935) also represents the maximum risk, no matter how far the price of an XLE share might fall between now and June expiration
- The breakeven price for this trade is $44.35 (equal to the strike price plus the cost of the option). This means that if we hold this position all the way to June expiration, if XLE is above that price this trade will make money and if XLE is below that price this trade will lose money.
Now let's look at the "Greek" value. These values ARE NOT static and can and will change as time goes by and as the price of XLE shares rises or falls. But they do tell us what we can expect as of right now. For the record, yes a lot of people's eyes do start to glaze over when they contemplate option greeks. However, if you want to succeed in options it is important to understand that these values convey a great deal of useful information in helping you to understand the potential rewards and risks of a given position. To wit:
- Delta = 76.06: This is essentially the "stock position equivalent". In other words, this position is presently roughly equivalent to holding 76 shares of XLE. So, in theory, if XLE gained $1 a share today this option would increase in value by roughly $76 based solely on the change in price.
- Gamma = 2.171: Gamma tells us how much the Delta is expected to change if XLE gained $1 in price. So, if XLE gained $1 a share today, the Delta for this option would increase from 76.06 to roughly 78.231.
- Vega = $7.94: Vega is a dollar figure that tells us how much value the position would change if the implied volatility for this option rose by one full point. The current IV for this option is 49.57%, so if it increased to 50.57% today this position would be expected to gain $7.94 in value based solely on that increase in volatility.
- Theta = -$0.73: Theta is a dollar figure that tells us how much value the position would change based solely on the passage of one day of time (i.e., time decay, the process whereby options lose their time premium as option expiration draws closer). So this position is expected to lose $0.73 in value due solely to time decay.
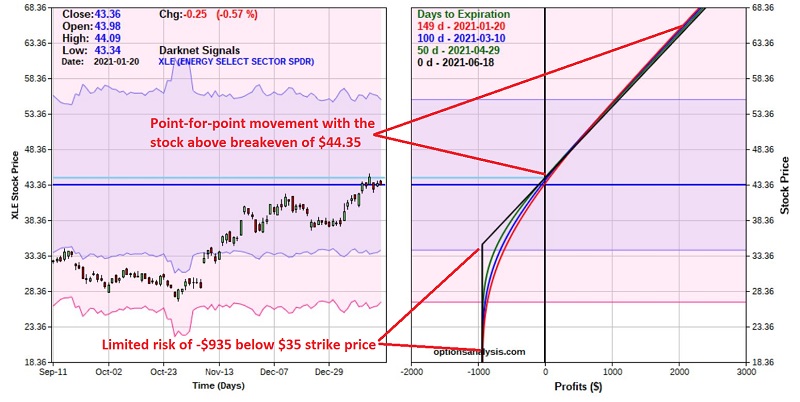
The chart below displays the risk curves for this position. Note that each colored line represents the expected dollar gain or loss as of a given day based on the price of XLE shares.
Important things to note:
- Above the breakeven price of $44.35 the option price moves in a straight line.
- Below the breakeven price of $44.35 and above the strike price of $35 we see the effect of "time decay", i.e., at each price the position loses more value the closer we get to option expiration.
- Below $35 a share the loss is limited to -$935.
Comparing the Two Positions
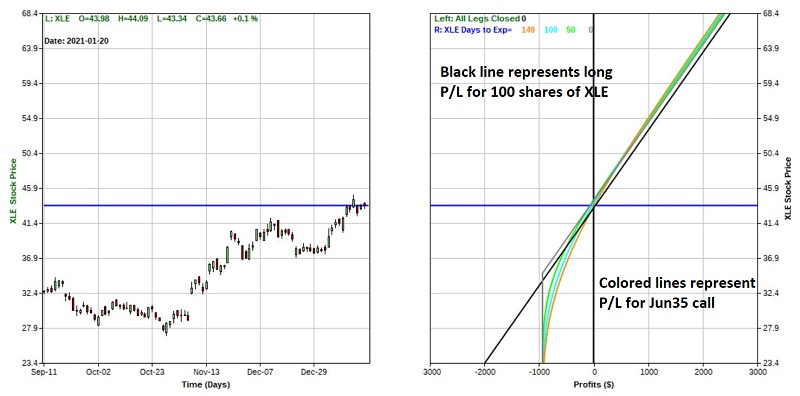
To get a better sense of what this position accomplishes, the chart below overlays the two positions – one holding 100 shares of stock and the other holding one June 35 call option.
Important things to note:
- The black line represents the expected dollar profit or loss for the long 100 shares of XLE position.
- The colored lines represent the expected dollar gain or loss as of a given day based on the price of XLE shares.
- If XLE rises above $44.35 the two positions move point-for-point (although the stock position has a slightly higher dollar profit because the option buyer paid $0.99 in time premium, i.e., strike price of $44 plus premium of $9.35 minus stock price of $43.36 = $0.99).
- If XLE price declines the stock position continues to lose -$100 for each $1 that XLE declines in price.
- If XLE price declines the option position has a maximum risk of -$935 at expiration if XLE is below $44 a share.
- Below $44 a share and above $35 a share the open loss on the option position increases as time goes by due to time decay.
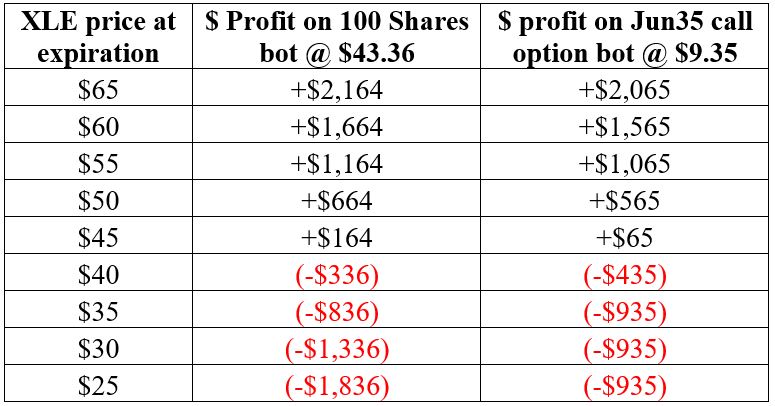
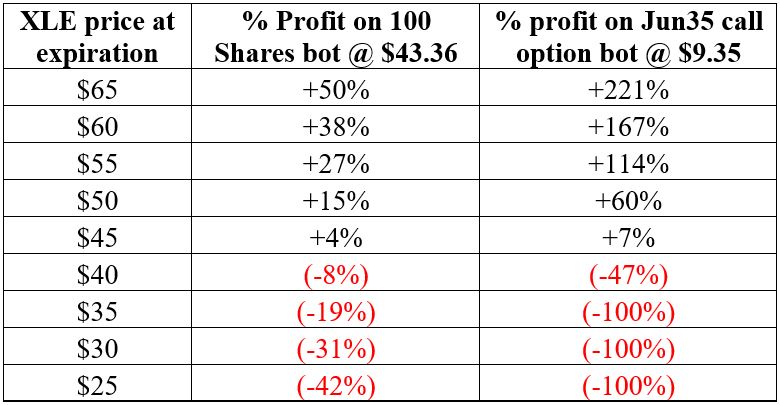
Now let's compare P/L possibilities for these two trades. But before we do, remember this:
- The stock trade cost $4,336 to enter
- The stock replacement option trade cost $935 to enter
The Pros and Cons of the Stock Replacement Strategy
The primary advantage of the stock replacement strategy is that if done properly it:
- Can allow you to achieve roughly the same dollar return as a stock share position at a fraction of the cost.
- Also allows you to limit your risk in a worst-case scenario.
Among the disadvantages are:
- In-the-money options cost are often thinly traded which can result in large bid/ask spreads.
- When option expiration rolls around you either have to get out or you have to pay another premium to maintain a position.
- You do not receive any dividends holding a call option.