
Option traders offer a clue (and how to turn an indicator into a system)

Key points
- The collective action of index option traders can offer clues about the overall stock market
- Trading in SPY options recently reversed from an extreme, which historically has suggested higher prices going forward
- Below, we also detail turning this "signal" into a "system" using our Backtest Engine 2.0
The SPY Open Interest Ratio generates a favorable signal for stocks
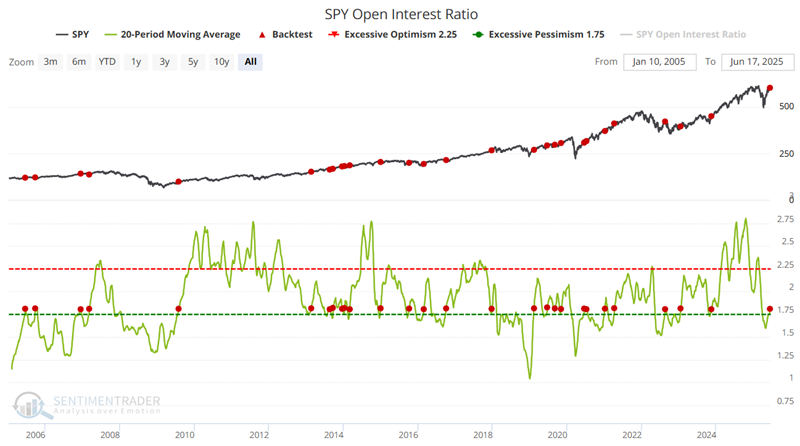
The SPY Open Interest Ratio shows the number of outstanding put options divided by the number of outstanding call options. The daily data can be "spiky" due to option expiration, so it's best to ignore extreme one-day moves and look at the trend over the past 10 or 20 days. When traders have been holding many more puts relative to calls in these ETFs, they have tended to struggle going forward. The market tended to rise when there were few puts relative to calls.
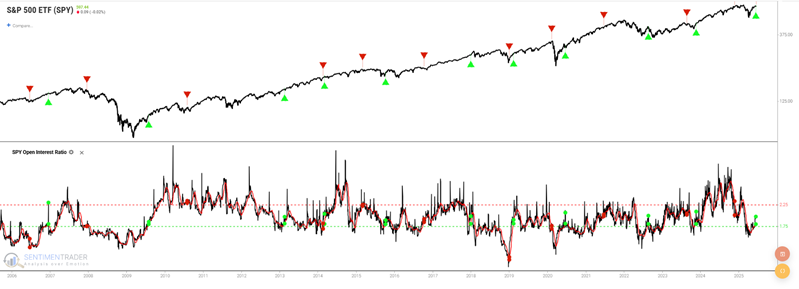
The chart below highlights all dates when this indicator's 20-day moving average crossed above 1.80, including overlapping signals.
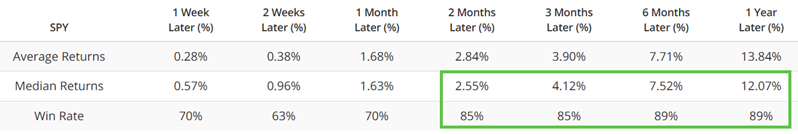
The table below summarizes subsequent SPY performance. The good news is the consistently high Win Rates for two months and beyond. Note, however, that median returns are decent but unspectacular.
The table below shows signal-by-signal results for SPY, including all overlapping signals.
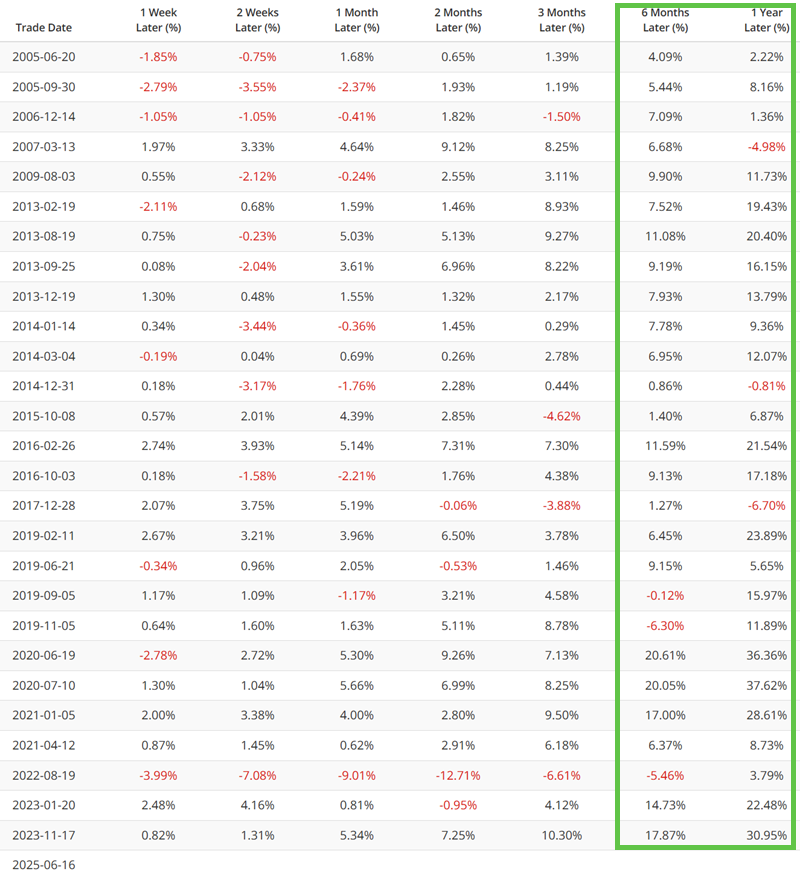
The best news is the lack of "way wrong" signals. The worst 12-month decline registered was a manageable -6.17% following the 2017-12-28 signal. Given the consistently high Win Rates historically, the recent signal on 2025-06-16 places this indicator on the favorable side of the weight of the evidence ledger.
Creating a more "systematic" approach
Let's examine how to turn this signal into a systematic approach in Backtest Engine 2. First, select "Tools" from the website main menu, then "Backtest Engine V2.0."
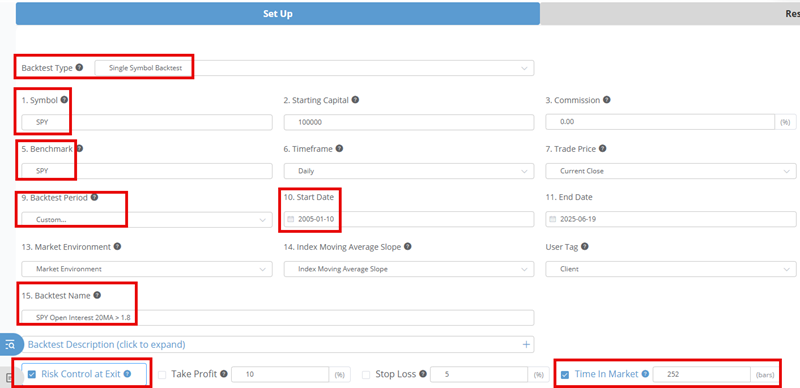
Under "Setup," we will select "Single Symbol Backtest" and then set the symbol to SPY. Next, we will set the Start Date to the first date for SPY Open Interest Ratio data (2005-01-10).
We give the test a name and, in this example, set our trade exit criteria to 252 trading days after an entry signal (Note that any new signal that occurs within 252 trading days of the previous signal will be ignored since theoretically, we are already in a trade).
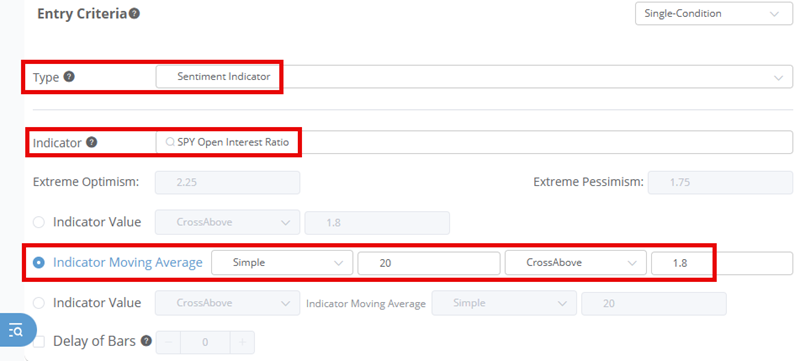
For our Entry Criteria, we select "Sentiment Indicator" and enter "SPY Open Interest Ratio" as the Indicator.
Finally, we will set the Indicator Moving Average to 20 and a cross above 1.8 as the trigger.
We then click Run to launch the test. The chart below displays the entry signals marked with green arrows, and the exits (252 trading days after each entry) with red arrows.
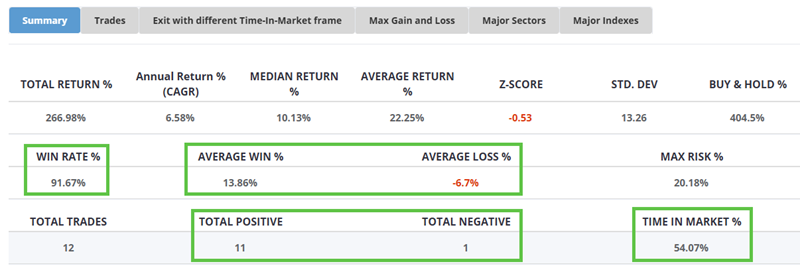
The table below summarizes the results of the backtest.
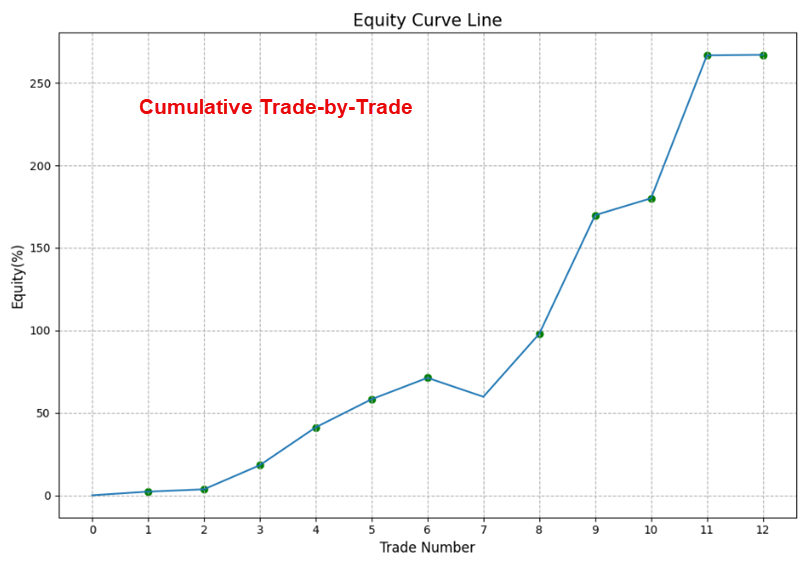
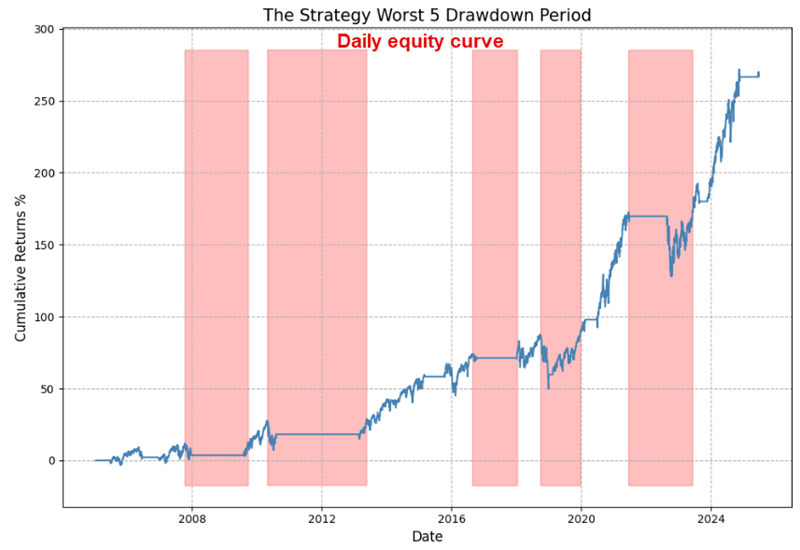
The two charts below display the hypothetical cumulative percentage gain or loss. The first chart accumulates the net return at the end of each trade; the second chart shows results daily (which allows a closer visual assessment of equity volatility and drawdowns). Ideally, both measures will trend from lower left to upper right.
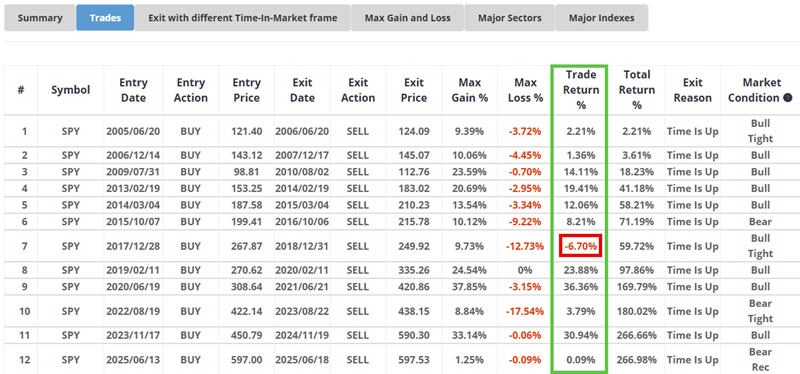
The table below displays results on a signal-by-signal basis. Note that this analysis ignores any overlapping signals that may occur during the trade holding period (which we set to 252 trading days in this case). Also note that the last trade listed is an open trade (signaled on 2025-06-13 and showing results through the most recent data, i.e., 2025-06-18).
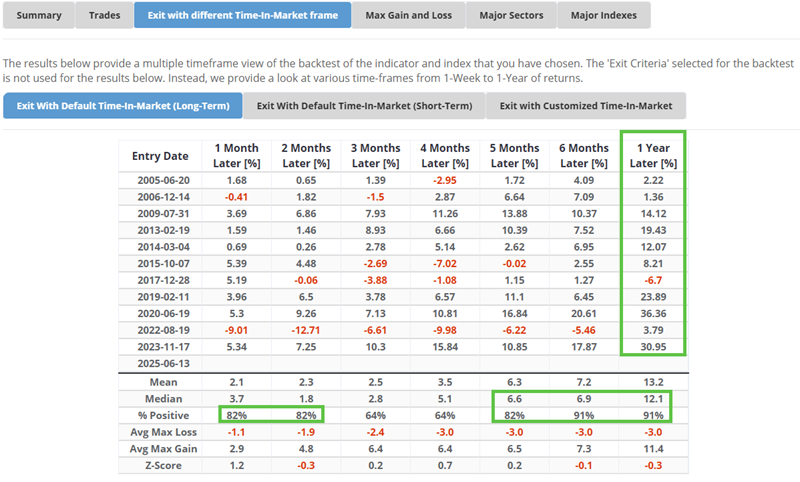
The table below displays SPY results during different periods after each signal. FWIW, I like to see consistently high % Positive values (80% or more) as a sign that I can have confidence in the signal going forward.
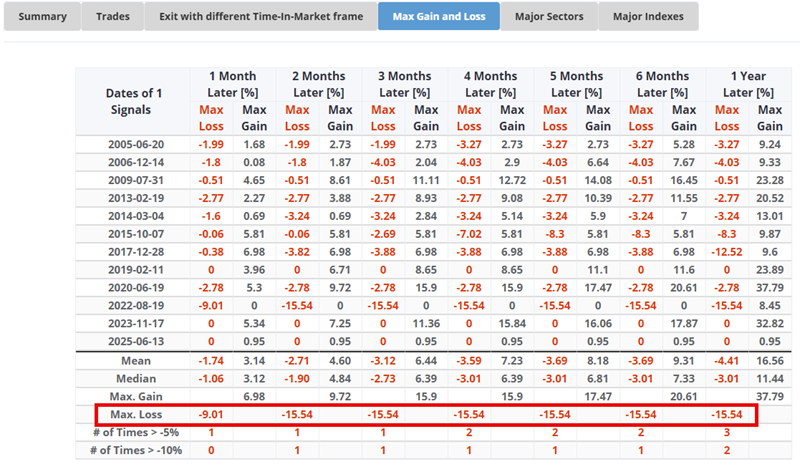
It is important to have realistic expectations when entering any trade. The table below highlights the maximum % gain and maximum % loss achieved by SPY during each trade. This data can help determine whether and where to place a stop-loss order and/or whether to take full or partial early profits. Sticking with a particular strategy may be difficult if the maximum drawdown is consistently high.
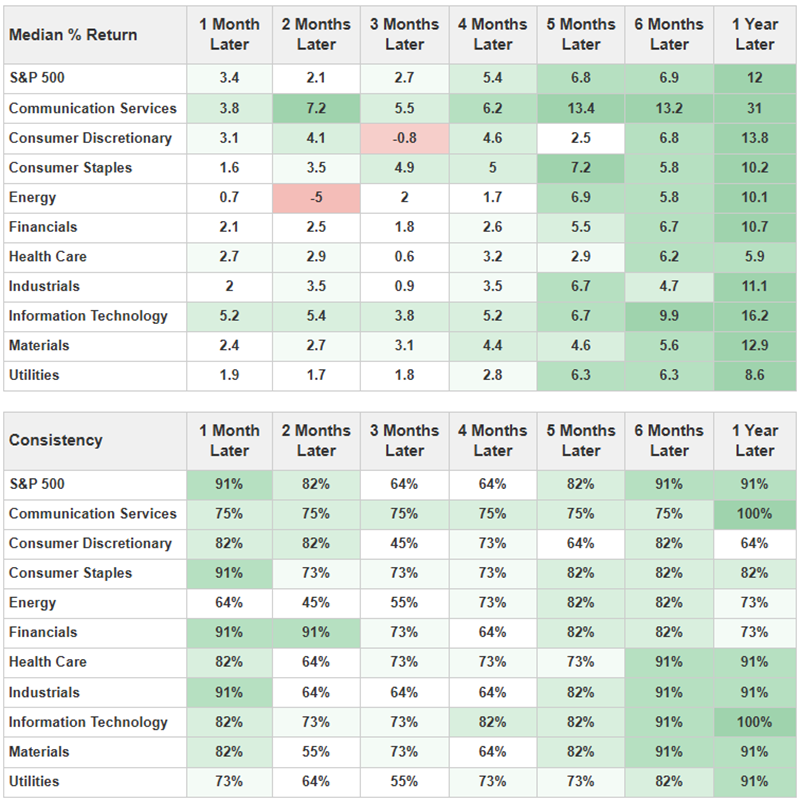
The table below shows performance for the S&P 500 sectors following the generated signal dates. It may be possible to find opportunities for greater and/or more consistent returns in specific sectors rather than simply holding and S&P 500 index fund (although this can entail a higher degree of risk; SPY returns are based on movements of the broader market, while individual sector performance can vary significantly from signal to signal based on the specific fundamental and/or technical status of a particular sector).
What the research tells us…
The results from our Backtest Engine 1.0 reveal that the SPY Open Interest Ratio indicator highlighted above has a good (albeit imperfect) record of identifying potentially favorable opportunities in the broader stock market. The results generated in our Backtest Engine 2.0 allow us to analyze the viability of this signal more in-depth.