
Optimistic Extremes Jump Above 40%

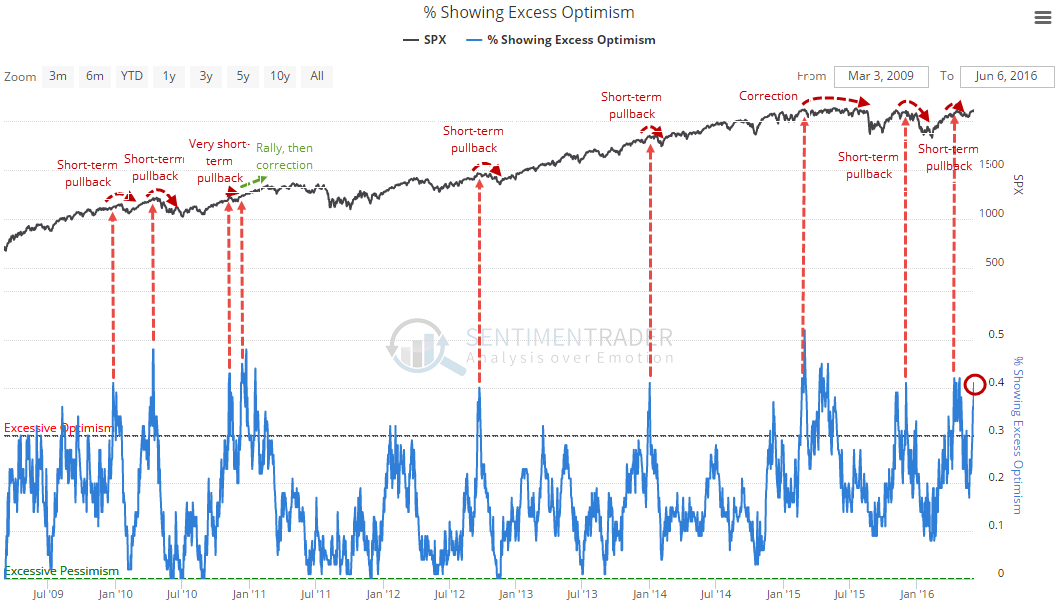
In last night's Report, we touched on the fact that due to a sudden jump of indicators moving into extreme territory, the percentage of our indicators showing an optimistic extreme moved above 40%, a reason for caution.
Since 2010, the S&P 500 has returned an annualized -34.9% when the percentage was above 40%, versus +45.1% when it was below 10%. Looking at the chart, it's clear that stocks have struggled, at least short-term, when the percentage reached this height.
The only real failure to see some weakness occurred in late 2010, when stocks continued to rise methodically into February 2011 before ultimately given back all of those gains and then some.
Going back to 2000 and using a signal approach, here is how the S&P fared in the 30 days after the percentage of indicators at an optimistic extreme first moved above 40%.
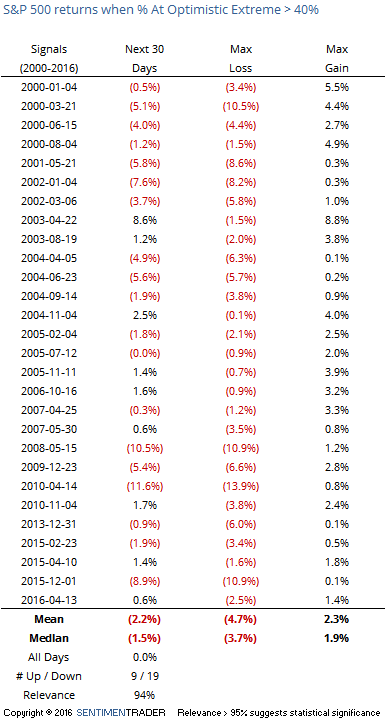
Again, poor results. The S&P was higher only 9 out of 28 times and its maximum loss was about double its maximum gain.
This is a horribly difficult juncture for stocks. Rarely do we see such conflicting evidence as has been discussed in the reports in recent weeks (and months). We've seen from recent studies that a breakout to new highs has consistently led to positive returns (and we still have the lingering positives from the breadth and momentum thrusts in February/March), yet stocks have struggled when sentiment is at current levels.
There is simply no good way to reconcile that, other than to perhaps hedge in the short-term, assuming that the positives - which have tended to have a longer time frame - will ultimately win out. In the very short-term, we'll be looking for the potential of a false breakout in the coming days, where stocks poke above recent highs, suck in short-term buyers, then reverse and cause some swift selling pressure.