Data &
Technology
Research
Reports
Report Solutions
Reports Library
Actionable
Strategies
Free
Resources
Simple Backtest Calculator
Simple Seasonality Calculator
The Kelly Criterion Calculator
Sentiment Geo Map
Public Research Reports
Free Webinar
Pricing
Company
About
Meet Our Team
In the News
Testimonials
Client Success Stories
Contact
Log inLoginSign up
< BACK TO ALL REPORTS

Opening Gap Odds As Investor Optimism Doubles

Jason Goepfert
2016-03-10
null

Buyers are coming in hard this morning, ostensibly due to further measures announced by the ECB. Whatever the reason, futures are indicated to open more than 0.75% higher than Wednesday's close, which would be a two-month high.

Using the S&P 500 fund, SPY, there have been 64 times it has shown such a gap. From the open to close, the S&P added to its gains only 41% of the time, averaging -0.3%. When it was below the 200-day average, it gained 6 out of 14 times, averaging -0.4%.

When this occurred below the 200-day, the only times the S&P was able to maintain any substantial gains over the next several sessions were in October 1998 and April/May 2009, as stocks were emerging from steep sell-offs. As always, if stocks can continue to shrug off probabilities like this and power higher, it adds to the evidence of even higher prices in the medium-term. Futures are fading a bit as this gets published, but even if the opening gain is above 0.5%, the short-term stats were similar to the above.

The rally has taken hold among individual investors, with the latest survey from AAII showing that bullish sentiment has doubled from the lows. The Bull Ratio was at a lowly 28% a month ago compared to 61% as of today's release.

This isn't necessarily a bad thing. Increasing bullishness is good for markets, as long as it doesn't get too bullish.

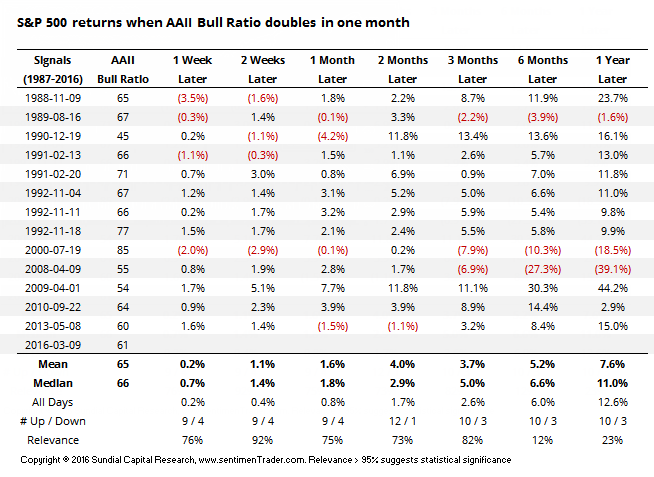
Going back to the survey's inception, here are the returns in the S&P when the AAII Bull Ratio doubled over a one-month period:

20160310_aaii_table

Two months later, the S&P was higher 12 out of 13 times, averaging a healthy gain of 2.9%. The sole loss was small and quickly reversed in the weeks following. This is also one of the smaller Bull Ratios in the table, adding a bit to the positive tone.

There were five other weeks (in 1988, 2000, 2008, 2009 and 2013) when ratio had been at its lowest level in a year before it doubled, not including our current instance. Returns going forward were in line with the others, showing no additional bullish inclination.

The gap open does not look promising for those looking to chase short-term strength, but again we're seeing the kind of activity that is associated with momentum markets, and those rarely just roll right over into medium-term declines.

Sorry, you don't have access to this report

Upgrade your subscription plan to get access
Go to Dasboard
DATA &
TECHnologies
IndicatorEdge
‍
BackTestEdge
‍
Other Tools
‍
DataEdge API
RESEARCH
reports
Research Solution
‍
Reports Library
‍
actionable
Strategies
Trading Strategies
‍
Smart Stock Scanner
‍
FREE
RESOUrCES
Simple Backtest
Calculator
Simple Seasonality
Calculator
The Kelly Criterion
Calculator
Sentiment Geo Map
‍
Public Research Reports
‍
Free Webinar
COMPANY
‍
About
‍
Meet our Team
‍
In the News
‍
Testimonials
‍
Client Success Stories
Pricing
Bundle pricing
‍
Announcements
‍
FAQ
© 2024 Sundial Capital Research Inc. All rights reserved.
Setsail Marketing
TermsPrivacyAffiliate Program
Risk Disclosure: Futures and forex trading contains substantial risk and is not for every investor. An investor could potentially lose all or more than the initial investment. Risk capital is money that can be lost without jeopardizing ones’ financial security or life style. Only risk capital should be used for trading and only those with sufficient risk capital should consider trading. Past performance is not necessarily indicative of future results.

Hypothetical Performance Disclosure: Hypothetical performance results have many inherent limitations, some of which are described below. No representation is being made that any account will or is likely to achieve profits or losses similar to those shown; in fact, there are frequently sharp differences between hypothetical performance results and the actual results subsequently achieved by any particular trading program. One of the limitations of hypothetical performance results is that they are generally prepared with the benefit of hindsight. In addition, hypothetical trading does not involve financial risk, and no hypothetical trading record can completely account for the impact of financial risk of actual trading. for example, the ability to withstand losses or to adhere to a particular trading program in spite of trading losses are material points which can also adversely affect actual trading results. There are numerous other factors related to the markets in general or to the implementation of any specific trading program which cannot be fully accounted for in the preparation of hypothetical performance results and all which can adversely affect trading results.

Testimonial Disclosure: Testimonials appearing on this website may not be representative of other clients or customers and is not a guarantee of future performance or success.