
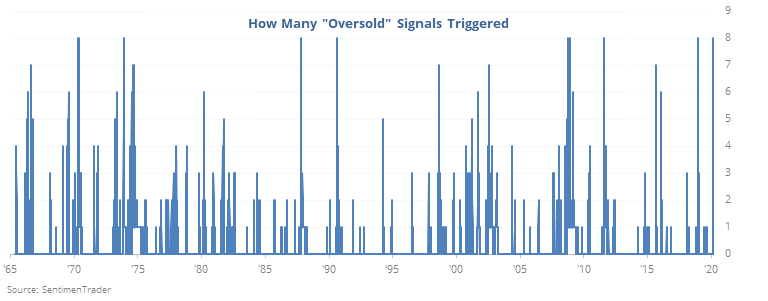
Opening crash even as oversold signals pile up

Panic Porn
There's a whole lot of hysteria out there right now, and frankly some of it is justified. When the largest players in markets are calling the others "crazy," it's hard to use any historical precedents.
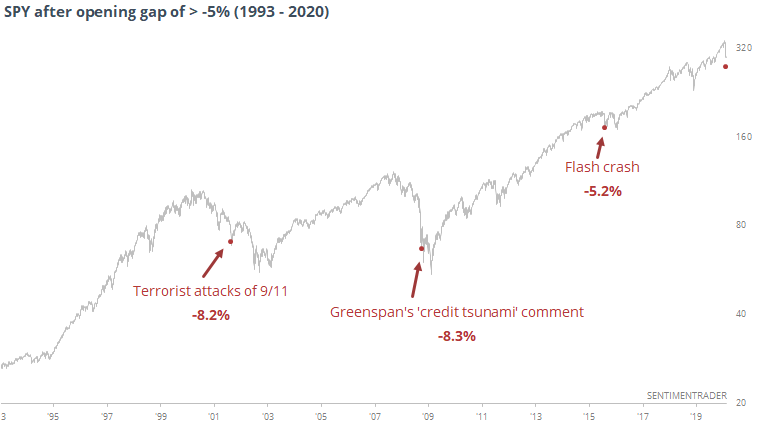
We went over most of the extremes that have popped up on our radar on Saturday, so there's no use in going over even more. The main question this morning was what's happened after other times that stock futures were frozen overnight.
When it happened, there was a very strong bias in the days ahead, with those who panicked at the open rarely benefiting, at least over the next several sessions. The panic spread to arguably the most important ETF in the world as well, which suffered one of its most notable historical re-pricings at the open.
Whether it made sense to join the sellers is a matter of risk tolerance and time frame. For those with a shorter-term point of view, the answer was pretty clear.
A(nother) week for the ages
Again last week, we put out a special report highlighting the most notable developments in price action, breadth, volatility, and sentiment.
When we go back and look at those basic criteria, we can sum them up in the table below. It looks at times the S&P 500 suffered at least 3 ‘shock’ days in the past two weeks, suffered at least a 10% decline at some point over the past 1, 2, or 4 weeks, saw the VIX spike higher than 30, showed a Stock/Bond Ratio below -2, averaged a 10-day Up Issues and Up Volume Ratio below 35%, and saw a net -30% of NYSE issues at new highs – new lows. The S&P also had to be at a 90-day low or worse at the time.
Going back to 1965, there have been a handful of days that met all the criteria. Some of them had slightly lesser extremes than we saw last week, some had bigger. But they all met each of them at the very least.
This kind of analysis can be dangerous, and hopefully you take a skeptical eye when you see it. It’s very easy to pick and choose only certain indicators or thresholds when going back over time, and making sure to only choose the ones that looked good.
That’s not the case here – we’re only using ones we’ve recently discussed, and that have history back to at least 1965. Also, if we were trying to find a “perfect” bottom indicator, then we wouldn’t see any failures in the table, but we do.
Still, the overall takeaway is positive, which shouldn’t be a big surprise given the studies we’ve discussed lately. Short-term, extreme volatility after readings like this are not at all uncommon. A persistent decline most certainly would be.
This is an abridged version of our recent reports and notes. For immediate access with no obligation, sign up for a 30-day free trial now.
We also looked at:
- What happens after the Russell 2000 cycles from a 52-week high to 52-week low so quickly
- A look at the closest 100-day analog comparisons since 1928
- The "old VIX" jumped above 50
- Our Stock/Bond Ratio is nearing a record extreme since 1962
- Implied volatility across assets has spiked
- Global financial stress is jumping
- The First Hour, Last Hour indicator shows late-day buying interest
- We've seen a lot of "crashy" behavior
- Breadth is nearing historic washout levels
- Options traders are scrambling to buy put protection
- Wall Street analysts are downgrading technicals, upgrading fundamentals
- Our sentiment models have really moved
- The financial sector is seeing a washout
- So are leisure, airline, and energy stocks
- Oil is suffering one of the most compressed crashes ever
- Energy stocks have a record divided spread to Treasuries