
Only a handful of Industrial sector stocks are outperforming the S&P 500

Key points:
- Fewer than 7% of S&P 500 Industrial sector stocks outperformed the S&P 500 over a rolling 1-month period
- After similar performance trends, the Industrials sector struggled over the next three months
- On a relative basis, the sector underperformed the S&P 500 over a similar horizon
Should we be concerned about the severe underperformance of Industrial stocks
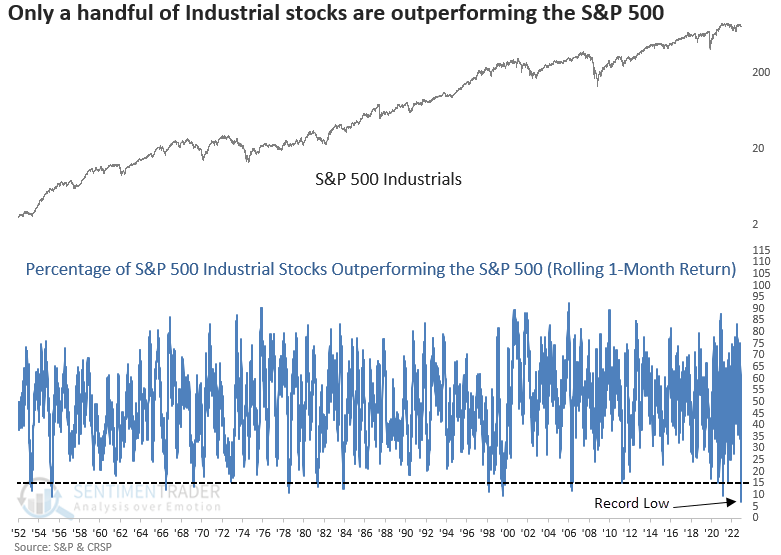
The percentage of S&P 500 Industrial sector stocks outperforming the S&P 500 Index over a rolling 1-month period declined to the lowest level in history.
As we've highlighted in recent notes, relative performance trends are being impacted by mega-cap stocks, especially from issues in technology-oriented industries.
With so few Industrial stocks outperforming the S&P 500, it's easy to extrapolate an ominous message about the stock market. As always, a signal-driven approach helps us to filter the facts from the narrative-driven noise.
Similar performance trends suggest Industrials could struggle
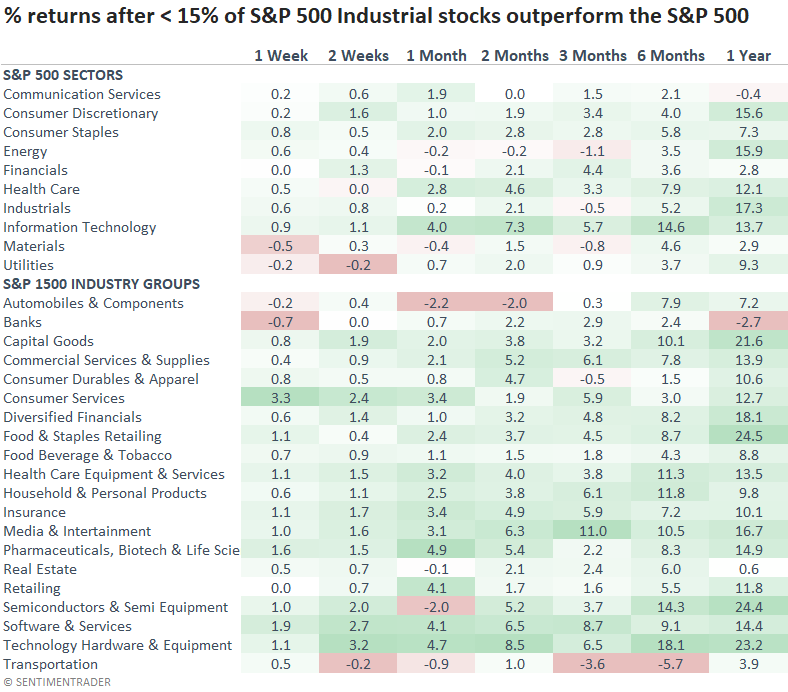
When the percentage of S&P 500 Industrial sector stocks outperforming the S&P 500 Index over a rolling 1-month period falls below 15%, the Industrials sector tends to struggle over the next three months. In all but one case, the group showed a negative return at some point over that time frame.
I used a threshold of 15% to include more historical instances.
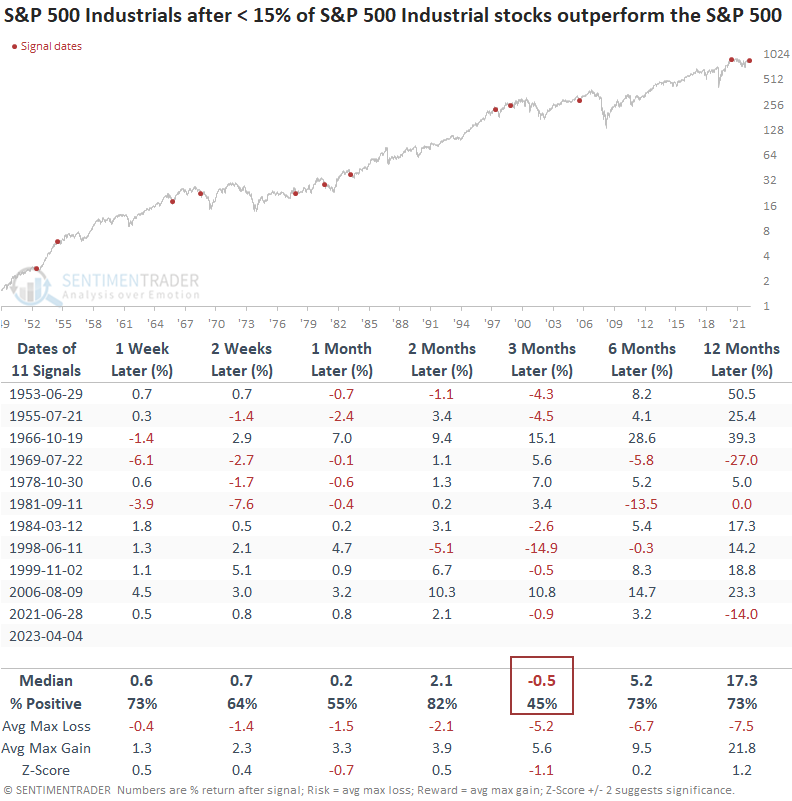
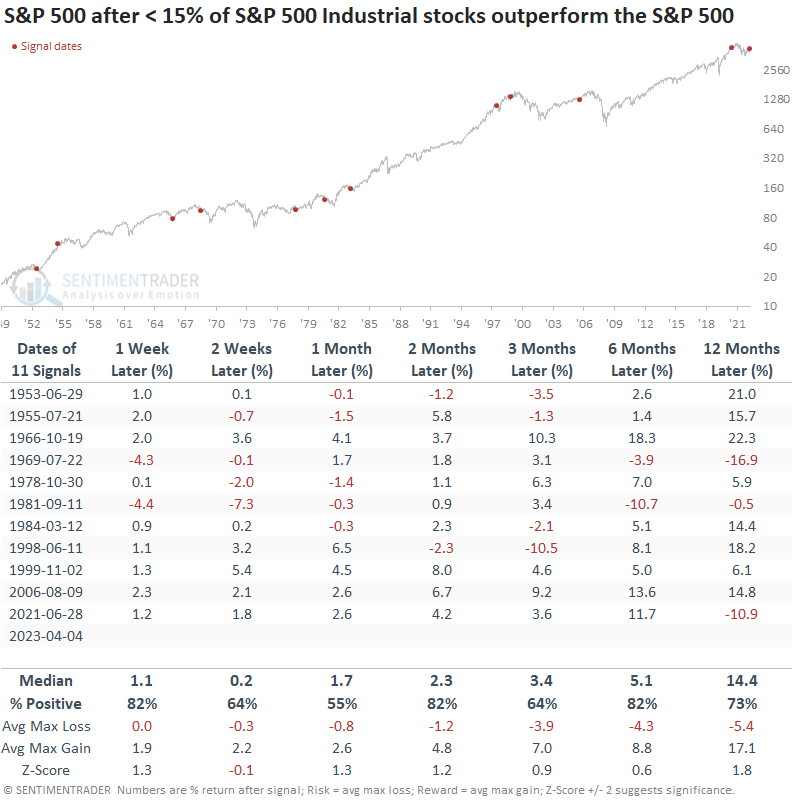
While the Industrials sector struggled, the signal did not impact the broad market. The S&P 500 had a consistent upward bias over the next three months. So, investors rotated to other groups.
When I compare Industrials to the S&P 500, the results suggest the cyclical-oriented sector could underperform the broad market over a medium-term horizon.
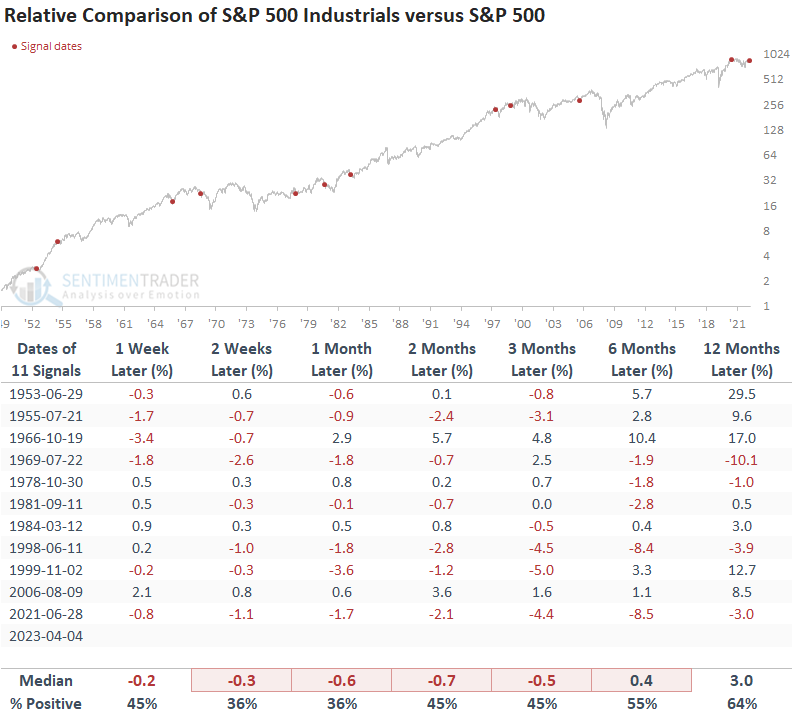
Interestingly, on a go-forward basis, growth-oriented Technology stocks could continue to outperform other sectors if history rhymes. And value/cyclical-oriented industries like Autos, Banks, and Transportation could underperform the broad market.
What the research tells us...
Mega-cap stocks maintain significant weightings in the S&P 500 Index. So, wild swings in a short-term indicator like the one used in this research note shouldn't be too surprising, especially since sector rotation is a characteristic of rangebound markets. When the percentage of S&P 500 Industrial sector stocks outperforming the S&P 500 Index over a rolling 1-month period falls below 15%, the Industrials sector struggled on an absolute and relative basis over the next three months. The extreme underperformance from Industrials at the expense of the S&P 500 did not lead to an ominous message for the broad market as some would have you believe.