Data &
Technology
Research
Reports
Report Solutions
Reports Library
Actionable
Strategies
Free
Resources
Simple Backtest Calculator
Simple Seasonality Calculator
The Kelly Criterion Calculator
Sentiment Geo Map
Public Research Reports
Free Webinar
Pricing
Company
About
Meet Our Team
In the News
Testimonials
Client Success Stories
Contact
Log inLoginSign up
< BACK TO ALL REPORTS

One Of These Curves Is Not Like The Others

Jason Goepfert
2019-08-15
null

Bulls yield

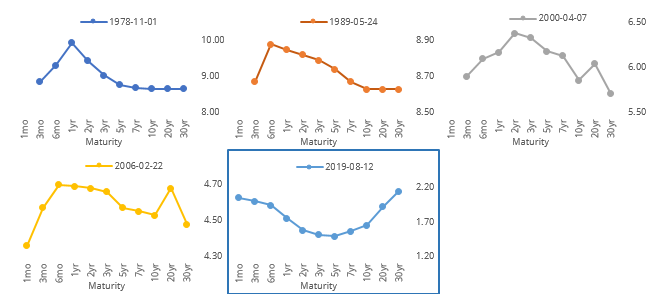
Stocks plunged on Wednesday, with the most common excuse being renewed fears of recession due to a further inversion in the Treasury yield curve. Between various maturities, 60% of the curve is now inverted. That preceded a prompt and severe drop in stocks in 2000, but the three other times it triggered, stocks continued to rise, and rise quite a bit.

One wrinkle is that this time, the curve through various maturities looks much different than it did during the others.

After the other times more than 60% of the curve inverted, consumer staples were the best bet, with gains every time and overall excellent returns. Energy stocks, utilities, and health care also did very well, not surprising since they’re mostly defensive sectors. Financials also held up.

If the defensive sectors did the best, then it’s not a big surprise that sectors like discretionary and technology tended to suffer, with the lowest returns and highest probability of a negative return.

Large and small failures

The drop on Wednesday was enough to push the Dow Industrials below its 200-day average, joining the small-cap Russell 2000 index. The S&P 500 and Nasdaq Composite both remain above their own averages.

The quick drop in the Dow from its high barely a month ago seems troubling but preceded only 4 really tough markets out of the 25 times this triggered. Over the next few months, the Dow fell more than -10% at some point four times, while rising more than +10% five times.

Safe haven bulls

Volatility in stocks has prompted investors to favor safe havens like gold and the Japanese yen. Optimism in both markets has become extremely high.

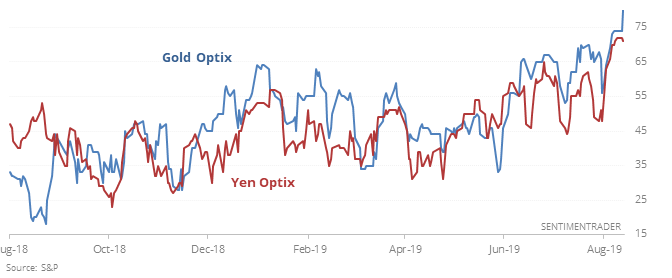
This tends to happen during volatile times for stocks, and has been a modest contrary sign, suggesting too much pessimism. Over the next 6-12 months, losses were rare, though 2007 was a major outlier.

Extremes

There will surely be more extremes to discuss in the next day. More than a third of our core indicators are now showing pessimism, the most since December. Traders bought the fewest call options in 6 months, and the relationship between stocks and bonds stretched to one of the widest in 50 years.

This post was an abridged version of our previous day's Daily Report. For full access, sign up for a 30-day free trial now.

DATA &
TECHnologies
IndicatorEdge
‍
BackTestEdge
‍
Other Tools
‍
DataEdge API
RESEARCH
reports
Research Solution
‍
Reports Library
‍
actionable
Strategies
Trading Strategies
‍
Smart Stock Scanner
‍
FREE
RESOUrCES
Simple Backtest
Calculator
Simple Seasonality
Calculator
The Kelly Criterion
Calculator
Sentiment Geo Map
‍
Public Research Reports
‍
Free Webinar
COMPANY
‍
About
‍
Meet our Team
‍
In the News
‍
Testimonials
‍
Client Success Stories
Pricing
Bundle pricing
‍
Announcements
‍
FAQ
© 2024 Sundial Capital Research Inc. All rights reserved.
Setsail Marketing
TermsPrivacyAffiliate Program
Risk Disclosure: Futures and forex trading contains substantial risk and is not for every investor. An investor could potentially lose all or more than the initial investment. Risk capital is money that can be lost without jeopardizing ones’ financial security or life style. Only risk capital should be used for trading and only those with sufficient risk capital should consider trading. Past performance is not necessarily indicative of future results.

Hypothetical Performance Disclosure: Hypothetical performance results have many inherent limitations, some of which are described below. No representation is being made that any account will or is likely to achieve profits or losses similar to those shown; in fact, there are frequently sharp differences between hypothetical performance results and the actual results subsequently achieved by any particular trading program. One of the limitations of hypothetical performance results is that they are generally prepared with the benefit of hindsight. In addition, hypothetical trading does not involve financial risk, and no hypothetical trading record can completely account for the impact of financial risk of actual trading. for example, the ability to withstand losses or to adhere to a particular trading program in spite of trading losses are material points which can also adversely affect actual trading results. There are numerous other factors related to the markets in general or to the implementation of any specific trading program which cannot be fully accounted for in the preparation of hypothetical performance results and all which can adversely affect trading results.

Testimonial Disclosure: Testimonials appearing on this website may not be representative of other clients or customers and is not a guarantee of future performance or success.