Data &
Technology
Research
Reports
Report Solutions
Reports Library
Actionable
Strategies
Free
Resources
Simple Backtest Calculator
Simple Seasonality Calculator
The Kelly Criterion Calculator
Sentiment Geo Map
Public Research Reports
Free Webinar
Pricing
Company
About
Meet Our Team
In the News
Testimonials
Client Success Stories
Contact
Log inLoginSign up
< BACK TO ALL REPORTS

One of the "Sharpest" Rallies in 60 Years Is Rolling Over

Jason Goepfert
2021-07-16
The S&P 500's rally over the past year has been one of the best risk-adjusted rallies in its history, generating a high Sharpe Ratio.

For investors, nirvana is a market showing steady and impressive gains without much risk. That pretty much sums up the past year.

Using a version of the Sharpe Ratio, the S&P 500 has seen the best risk-adjusted returns since late 2017 and ranking among the best ever. From Investopedia (edited for brevity):

The Sharpe ratio was developed by Nobel laureate William F. Sharpe and is used to help investors understand the return of an investment compared to its risk. The ratio is the average return earned in excess of the risk-free rate per unit of volatility or total risk. Volatility is a measure of the price fluctuations of an asset or portfolio.

Subtracting the risk-free rate from the mean return allows an investor to better isolate the profits associated with risk-taking activities. 

Generally, the greater the value of the Sharpe ratio, the more attractive the risk-adjusted return.

Methodologies for calculating the ratio can vary, and using it as a measure of portfolio managers' acumen is subject to fierce debate. It's still a handy way to determine just how ideal market conditions have been for investors.

For the S&P, its Sharpe Ratio is just now rolling over from an extremely high level.

S&P 500 Sharpe Ratio

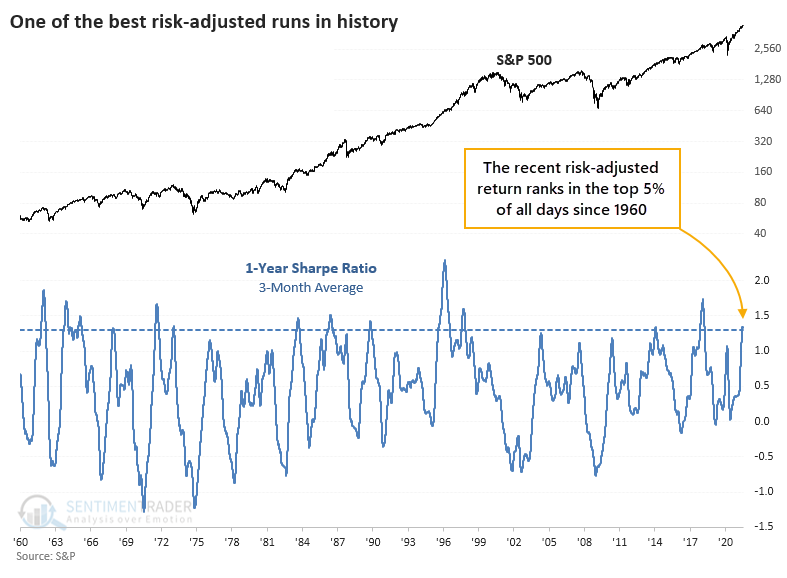
After other times the ratio got as high as it recently was and started to roll over, the S&P saw some weakness over the medium-term. 

If we focus on the next 1-6 months, only two signals saw the S&P continue its trend uninterrupted. The others either saw weakness at some point during that time frame or only minor gains.


What else we're looking at

  • Full returns in the S&P 500 following a high Sharpe Ratio that's rolling over
  • Sector and factor returns following a high and declining Sharpe Ratio
  • Two industries are giving opposite reversal signals
  • Options ideas to trade a pause in the rally in crude oil

Stat box

The 5-month trading range in the small-cap Russell 2000 is one of the tightest in 50 years. It has seen similar ranges 18 times, leading to an average 3-month future return of 0.6%, positive 50% of the time. Not very exciting for either past or future (average) returns.

Etcetera

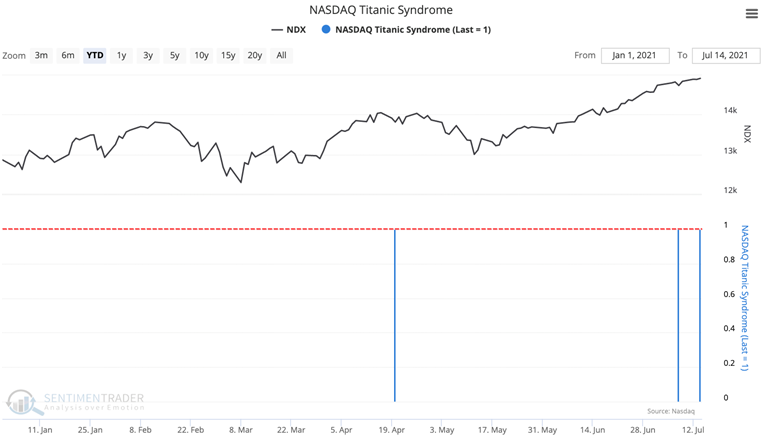
Maybe it'll float. The NASDAQ Titanic Syndrome triggered again on Thursday. This is the 3rd signal in the past 6 sessions. 

nasdaq titanic syndrome

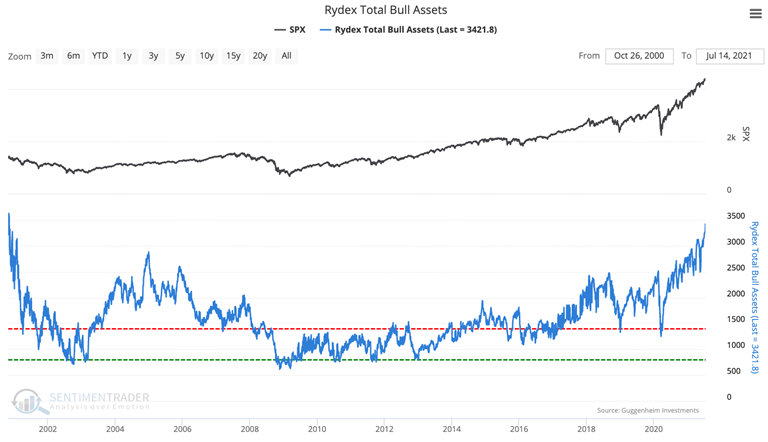
Mirror market. Total assets in bullish index funds at Rydex are at their highest level since November 2000, reaching $3.4 billion.

rydex total bull assets

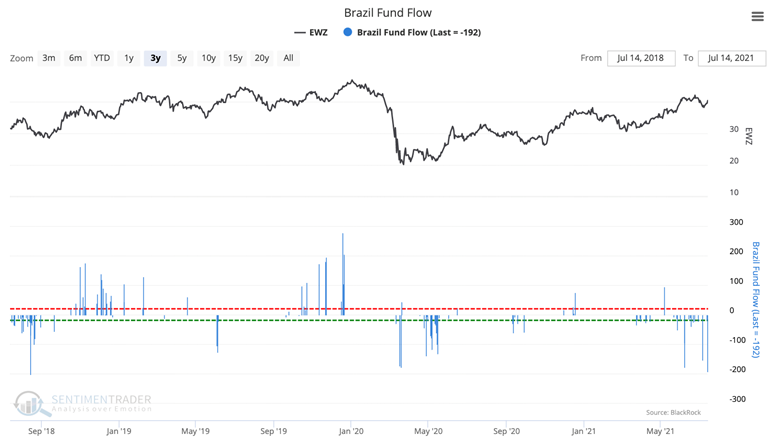
Waxed. The most popular ETF focused on Brazilian stocks, EWZ, has had its largest outflow since Aug. 2018, losing $192 million in assets in a single session.

brazil ewz fund flow

DATA &
TECHnologies
IndicatorEdge
‍
BackTestEdge
‍
Other Tools
‍
DataEdge API
RESEARCH
reports
Research Solution
‍
Reports Library
‍
actionable
Strategies
Trading Strategies
‍
Smart Stock Scanner
‍
FREE
RESOUrCES
Simple Backtest
Calculator
Simple Seasonality
Calculator
The Kelly Criterion
Calculator
Sentiment Geo Map
‍
Public Research Reports
‍
Free Webinar
COMPANY
‍
About
‍
Meet our Team
‍
In the News
‍
Testimonials
‍
Client Success Stories
Pricing
Bundle pricing
‍
Announcements
‍
FAQ
© 2024 Sundial Capital Research Inc. All rights reserved.
Setsail Marketing
TermsPrivacyAffiliate Program
Risk Disclosure: Futures and forex trading contains substantial risk and is not for every investor. An investor could potentially lose all or more than the initial investment. Risk capital is money that can be lost without jeopardizing ones’ financial security or life style. Only risk capital should be used for trading and only those with sufficient risk capital should consider trading. Past performance is not necessarily indicative of future results.

Hypothetical Performance Disclosure: Hypothetical performance results have many inherent limitations, some of which are described below. No representation is being made that any account will or is likely to achieve profits or losses similar to those shown; in fact, there are frequently sharp differences between hypothetical performance results and the actual results subsequently achieved by any particular trading program. One of the limitations of hypothetical performance results is that they are generally prepared with the benefit of hindsight. In addition, hypothetical trading does not involve financial risk, and no hypothetical trading record can completely account for the impact of financial risk of actual trading. for example, the ability to withstand losses or to adhere to a particular trading program in spite of trading losses are material points which can also adversely affect actual trading results. There are numerous other factors related to the markets in general or to the implementation of any specific trading program which cannot be fully accounted for in the preparation of hypothetical performance results and all which can adversely affect trading results.

Testimonial Disclosure: Testimonials appearing on this website may not be representative of other clients or customers and is not a guarantee of future performance or success.