
One of the Dow's Best Starts in 125 Years

The Dow just keeps chugging along.
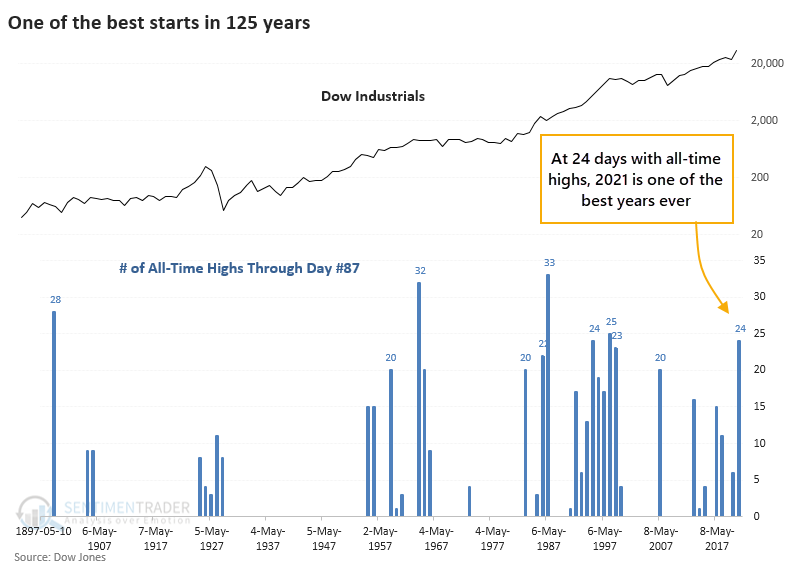
Despite some tumult under the surface and weakness in tech stocks and other speculative areas, the Dow Industrials Average has held up its reputation as a stalwart. The venerable index has been consistently strong enough to score 24 record closing highs this year alone. Through trading day #87, this is tied for the 6th-best year since 1896.
The big question is always, "So what?"
WHAT BIG MOMENTUM MEANT FOR FUTURE RETURNS
For investors, the most important factor isn't where we've been; it's what it might mean going forward. The table below helps answer that, as it shows returns in the Dow after the handful of other years with more than 20 all-time highs through trading day #87.
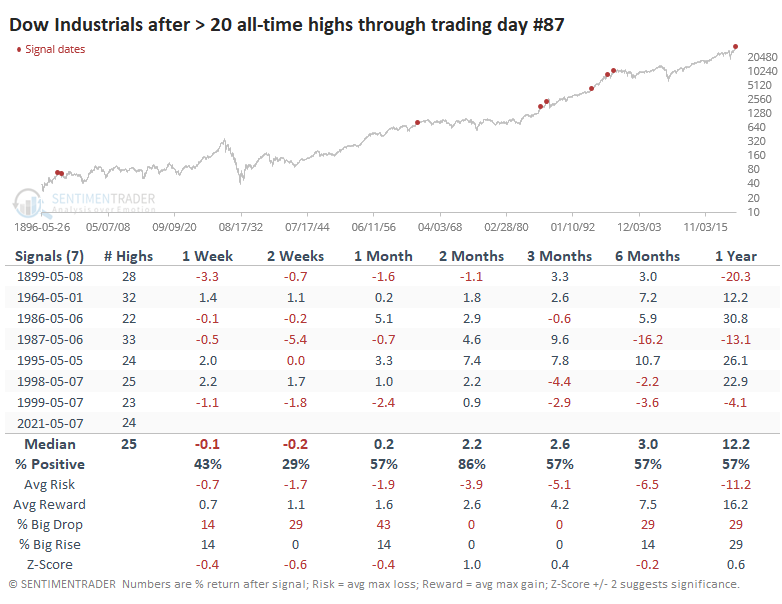
It was a bit of a struggle for the Dow to hold its momentum in the shorter-term, and even medium-term returns were mixed. Granted, relying on price action from 1899 - the year humans had just invented the paperclip - might be a stretch.
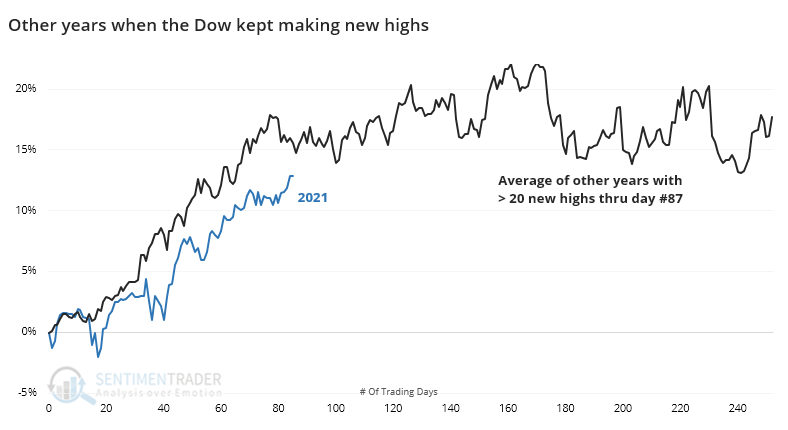
Looking at the average price path from those years, we can see the struggles once the year reached its current point.
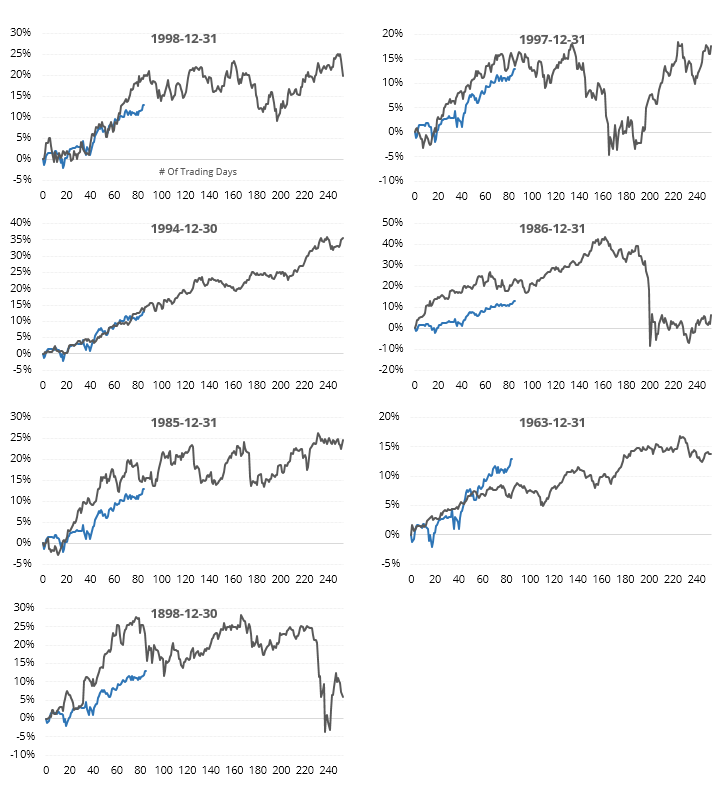
That's just an average, though, and looking at the individual instances, there was a do-or-die tendency. A couple of them took off on massive rallies; the rest petered out. It's interesting that out of 7 instances, 3 of them ended up in a crash scenario within the year.
GENERATING A LARGER SAMPLE
If we relax the parameters to 15 or more closing highs year-to-date, we can generate a larger sample size. While these might be less of a direct comparison, they at least give a clue to what happened during years with consistent upside momentum to start a year.
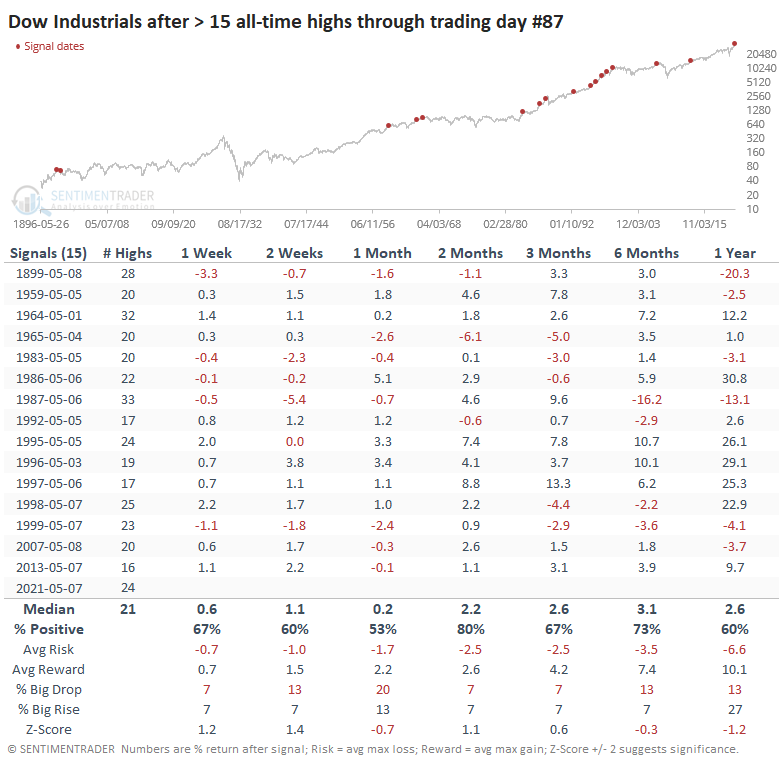
Here, the returns are more prosaic, but even with a doubling of the precedents, returns over the next month were mediocre. Up to 2 months later, average risk was higher than average reward.
In recent decades, like from 1995 forward, there were no losses over the next couple of months, with a few large gains. And that mid-1990s stretch also showed returns of more than 22% over the next year.
We tend to place more weight on recent occurrences, and the only two that are fresh in investors' memories are 2007 and 2013, both of which saw further gains during May, then a stumble into June before recovering with okay gains the rest of the year.
Like many other studies we've published showing historic momentum and a failure of anything but trend-following lately, this one suggests a flat or poor risk/reward setup for new capital over the short- to medium-term but mostly good longer-term.