
One Objective Measure of Dumb Money Flashes Yellow

Deep down, most every trader hopes to find something that will tell them the "just the right time" to buy and/or sell. In real-world trading it doesn't typically work that way. There are plenty of trading methods and systems out there that work very well and can help one to profit over time. But there are no "sure fire" methods. Ultimately it comes down to:
- Selecting an investment vehicle
- Weighing the odds
- Carefully allocating investment capital
- Ruthlessly controlling risk
For the purposes of this piece, we will focus solely on "weighing evidence." For at the moment, one of our "bread-and-butter" measures - Dumb Money Confidence - as I look at it, is flashing yellow. Let's takes a closer look at what this does - and does not necessarily - mean (It is important to note that no claim is made that what follows is the one and only best way to utilize this particular set of data. It's just one way.).
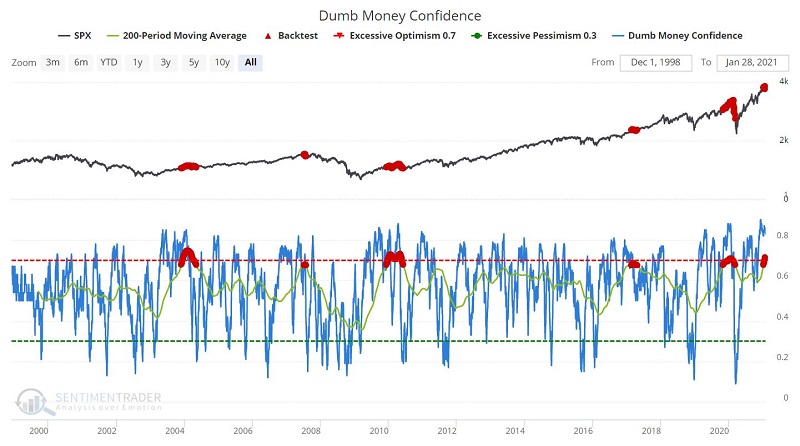
First off, the chart below displays the S&P 500 Index with Dumb Money Confidence and its own 200-day moving average (heretofore referred to as DMC200). Highlighted in red are those occasions when the 200-day moving average itself exceeded 0.67. Note at the far right that DMC200 has been above 0.67 since January 7, 2021, i.e., it is presently flashing a warning sign.
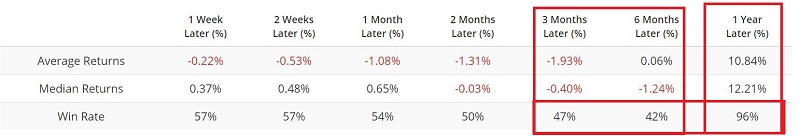
Does this matter? The table below highlights the fact that 3- and 6-month returns following such readings have been well below average. Interestingly, 12-month returns have been mostly very positive.
To illustrate, let's take a look at those previous times when the 200-day moving average crossed above 0.67.
There seems to be something of a knee-jerk reaction (desire?) among traders to see a high Dumb Money Confidence reading and want to shout "CRASH!" But my experience has been that what high DMC readings tells you is:
- NOT that the market is doomed to plummet any particular time in the immediate future
- But rather that the market is likely to struggle to sustain an advance / experience a great of volatility / and yes to experience a significant selloff sometime in the next 6 months
The historical difference between 3 and 6 month performance and 12 month performance (albeit based on a small sample size) also suggests that once the anticipated struggle/volatility/selloff is done, a significant buying opportunity may form.
So here is one theoretical approach:
- Following a DMC200 reading above 0.67, an investor might consider "playing some defense" (more on this topic later) for the next 3 to 6 months
- Once six months go by, look for signs of a bottom forming (using oversold and sentiment indicators), and/or, a new advance unfolding (using breadth and momentum indicators).
To address all of these possibilities, let's take a look at those times when the Dumb Money Confidence index 200-day moving average crossed above 0.67. Each chart below displays:
- The period of time when DMC200 is > 0.67 is contained in a red box
- The period from 6 to 12 months after the initial reading above 0.67 is highlighted by a green arrow
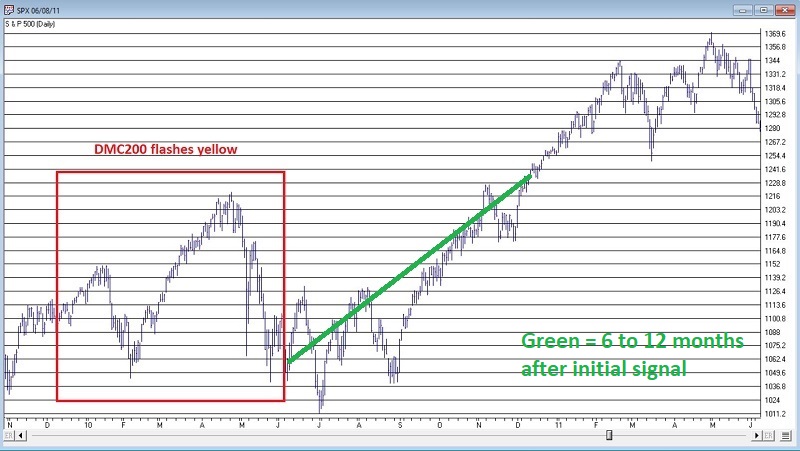
2003/2004
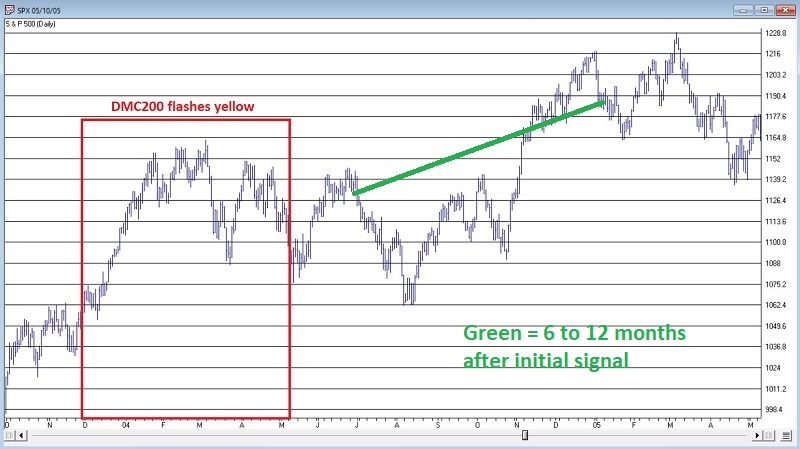
DMC200 flashed yellow from late 2003 into early May 2004. The November warning turned out to be early as the market rallied strong into late January 2004. However, from there the January market struggled mightily throughout most of 2004. Overall, the market traded sideways to lower for the better part of 9 months before bottoming in August 2004
2007
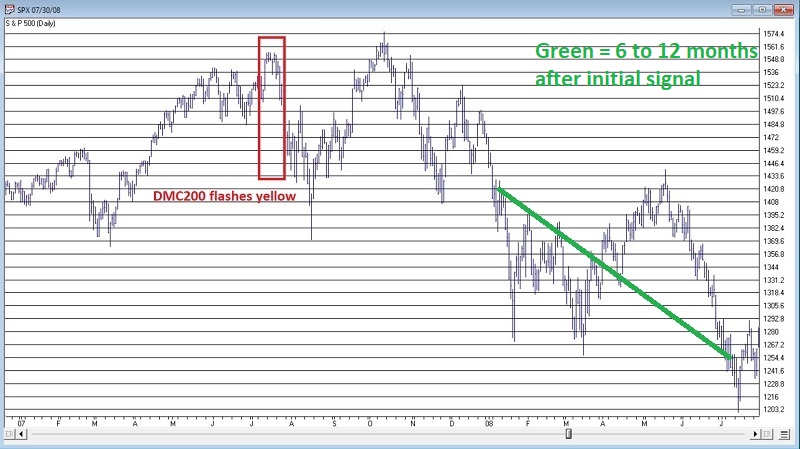
DMC200 flashed yellow from late June 2007 into early August 2007. In the year ahead the financial crisis worsened and the stock market tanked. This was the one case where the market did not bounce six months after the warning. In fact, in this case things got much worse.
2009/2010
DMC200 flashed yellow from early December 2009 into early June 2010. After a brief selloff into early February the market enjoyed a strong 3-month rally. And then the trouble really began. Measuring from the late January signal the market was unchanged over seven months later, so playing defense during that time may have helped. After August 2010 the market embarked on a +30% rally in six months.
2017
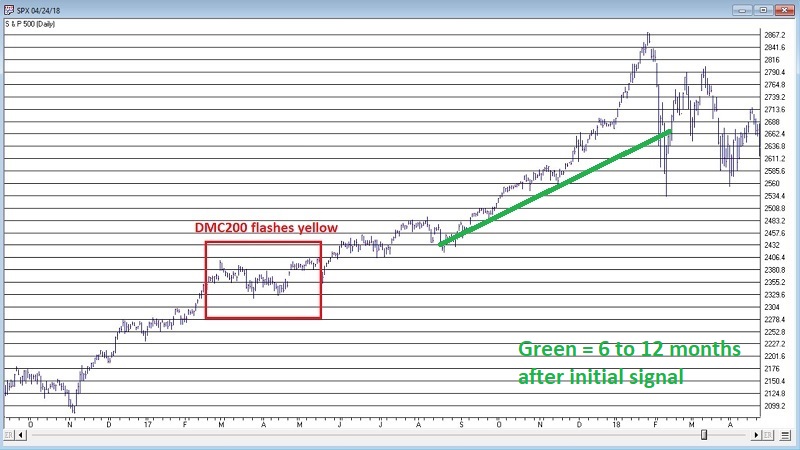
DMC200 flashed yellow from mid-February through April 2017. One can argue that these signals were not of much value in terms of warning of trouble. And maybe so. Still, it should be noted that the market moved mostly sideways from early March into late August. And only after the warning subsided did the market really take off in September of 2017.
2019/2020
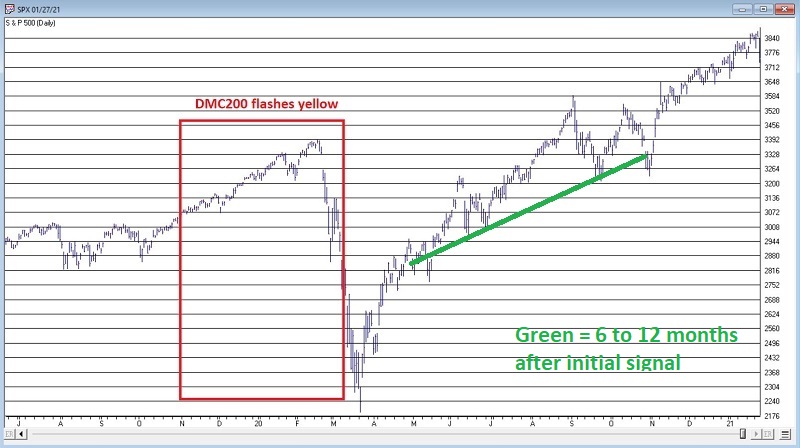
The DMC200 started flashing yellow at the end of October 2019 and stayed yellow into early March 2010. This warning signal looked like a dud at first. Everything seemed bullish and the market kept advancing into late February 2020. We all know what happened next. Once the bottom was put in a rally of epic proportions began. The second six months after the warning signs began witnessed a massive rally in the stock market (arguably, "right on schedule").
2021
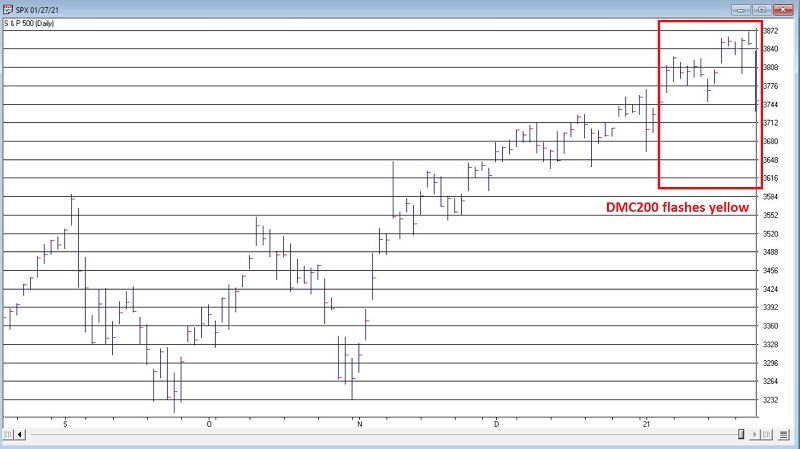
And so here we sit in early 2021 with the DMC 200-day moving average above 0.67, thus flashing a new warning signal. So, what happens now? Do we get a slow, steady advance like in 2017, a lot of volatility and some significant selloffs as in 2004 and 2010? Or full-on Armageddon like 2007/2008 and 2019/2020?
The reality is that it is impossible to predict exactly. But based on the history we just reviewed; investors may be wise to consider whether "playing defense" fits into their investment plans. This can include any or all of the following ideas:
- Raising some cash
- Raising stop-loss and trailing stop levels
- Selling covered calls
- Hedging with puts (either on individual stocks or an index as a portfolio hedge)
- Option collars
The other (and possibly more difficult) big change might be "adjusting one's attitude". The stock market has been generating a lot of "easy money" profits in the last 6-9 months. This can act like a drug. It makes investors feel good for awhile and increases their desire for more. But the stock market is never a one-way street for long. Investors who wish to prosper in the next 3 to 6 months may need to embrace this reality.