
One Example of Speculation in SLV

Part of my job is to help people "think like a trader." One problem is that no two people look at the markets in exactly the same way. So, where one person sees opportunity, another person sees risk (come to think of it, that is kind of why the markets exist in the first place).
What follows is not a "recommendation," but simply the assertion of one perspective as an example of one way to play a particular situation. You are encouraged to decide for yourself if the idea truly holds any merit.
TICKER SLV: SEASONALITY
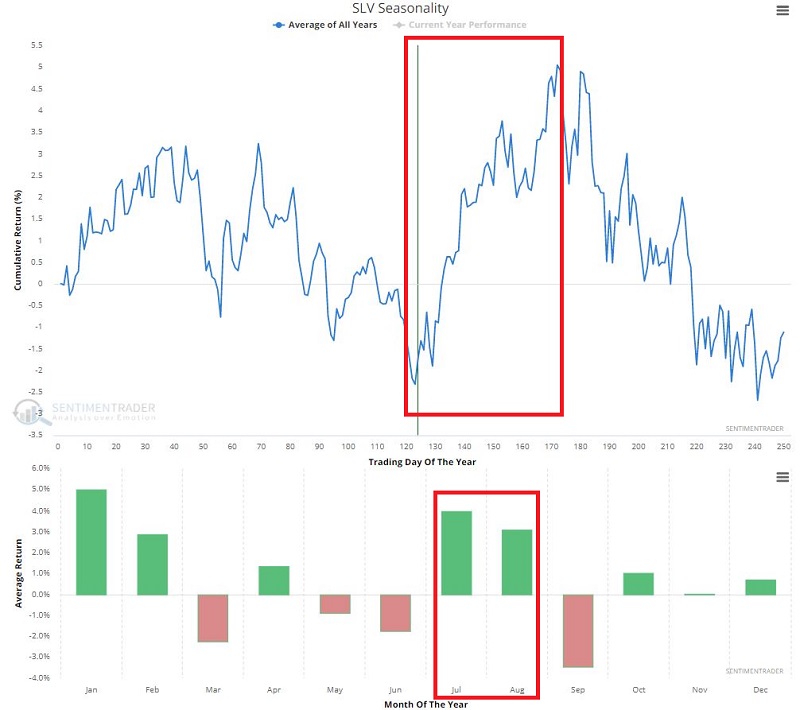
The chart below displays the Annual Seasonal Trend for ticker SLV (iShares Silver Trust ETF).
As you can see, we are entering a purportedly "favorable" time of year for silver.
- This period began at the close on Trading Day of the Year (TDY) #123 (which technically was 6/29/2021)
- The first major thrust runs through TDY #153 (8/11/2021)
- The ultimate seasonal peak occurs on TDY #172 (9/8/2021)
Likewise, as you can see in the bottom clip, July and August tend to be two of the better months of the year for SLV.
So, does all of this mean that SLV is guaranteed to race higher in the months ahead? Not at all. Every year is its own roll of the dice. But if we look to put the odds on our side, this seems like a decent place to start.
TICKER SLV: TREND
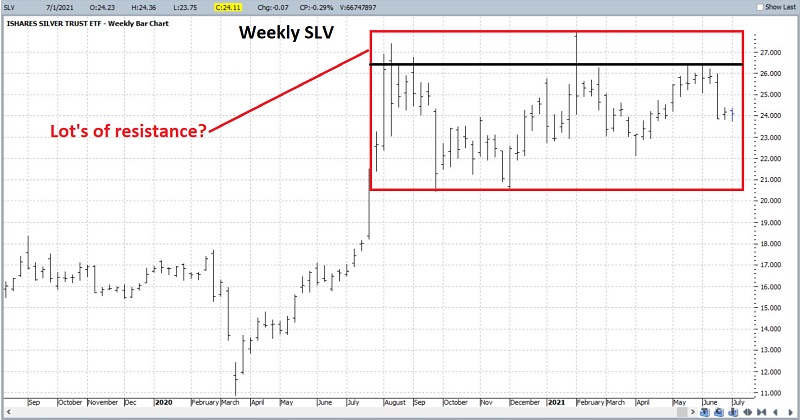
Let's dig just a little deeper and also consider "trends." Of course, as I mentioned before, different people will see different things. In the weekly chart below, it is pretty easy for a trader to decide that a "topping formation" is taking place and a breakout to the downside is likely (the weekly and daily SLV charts below are courtesy of ProfitSource).
At the very least, one can argue that SLV has "gone nowhere" for roughly 11 months.
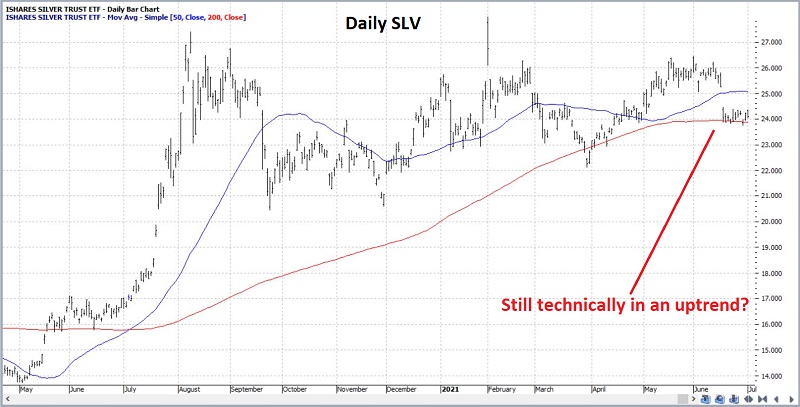
At the same time, another trader might focus on the daily chart below and decide that with the 50-day average above the 200-day average and with the price of SLV still holding (just barely) above the 200-day average, that on a trend-following basis, the trend of SLV is still "UP."
So, who is right and who is wrong? The argument could last all day. In the end, the reality is that we will only know in hindsight. So, the real questions are:
- Do I want to make a play?
- If "Yes," then what play do I want to make?
TICKER SLV: AN OPTIONS PLAY
The chart below shows a bar chart for SLV and the Implied Volatility for SLV options (black line). As you can see, IV is not rock bottom, but it has come down a great deal from the levels in 2020 and early 2021.
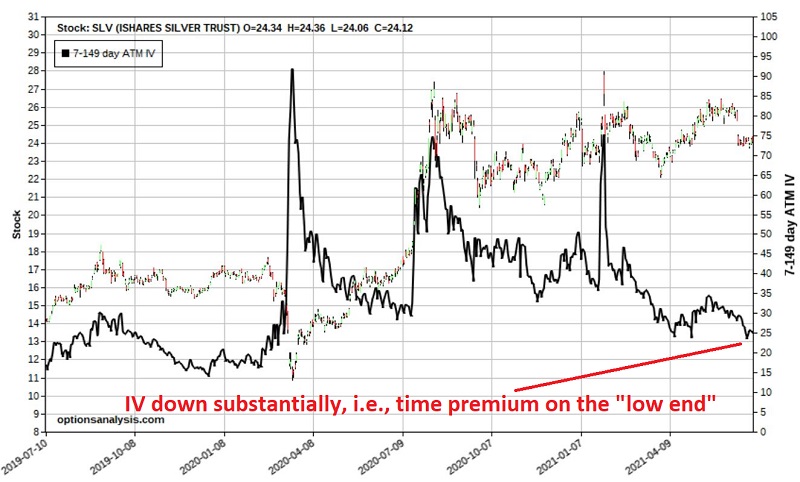
This matters because this reduction in IV tells us that the amount of time premium built into the price of SLV options has declined dramatically and that buying premium is a viable approach. So, let's take the most simplistic approach possible.
We are hoping for a bullish move into August and possibly into September. The most straightforward approach would be to buy 100 shares of SLV. At $24.12 a share, this requires a capital commitment of $2,412. For our purposes of (essentially rank) speculation, we will look to commit a great deal less capital by:
- Buying 2 Sep2021 SLV 24 calls @ $1.23
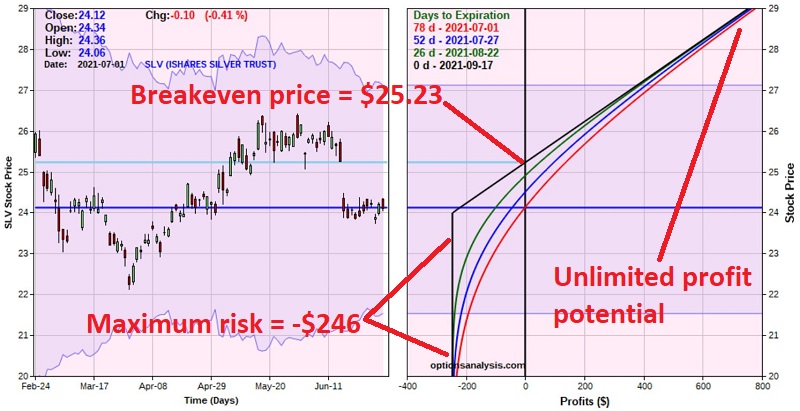
The particulars appear in the figure below, and the risk curves appear in the chart below that. Both are courtesy of www.Optionsanalysis.com.
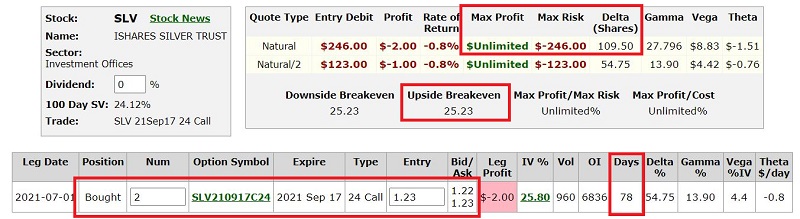
The key things to note:
- The cost to enter the trade - and the worst-case loss - is $246 (or about 10% as much as buying 100 shares of SLV)
- The trade has a "delta" of 109.5 (which means it is will behave much like a position holding 109 shares of SLV)
- The breakeven price at September expiration is $25.23 (bottom line: SLV MUST advance at some point for this trade to make money)
- There are 78 days to September expiration, so SLV has roughly 2.5 months to stage some advance above the breakeven price
SUMMARY
Is this a "good" trade or a "bad" trade? Like I said before, the merit of most trading opportunities is strictly "in the eye of the beholder." A trader who expects SLV to break to the downside could just as easily buy 2 September 2021 $24 put options to profit from a decline in the price of SLV shares.
Also, to repeat, I am making no predictions about SLV and am not offering this as a trading "recommendation." This entire exercise is simply an example of:
- Spotting opportunity (or at least "perceiving" to have spotted opportunity)
- Making a play to exploit said opportunity using a limited risk - and limited capital commitment - approach