
Once again, traders reach for speculative options

Starting in mid-May, options traders were becoming optimistic to a worrying degree. It reached a fever pitch by early June.
Behavior like that has historically led to extremely limited upside, and usually a correction that wipes away weeks or months worth of gains. And yet after a brief dip, here we are months later, talking about records in momentum.
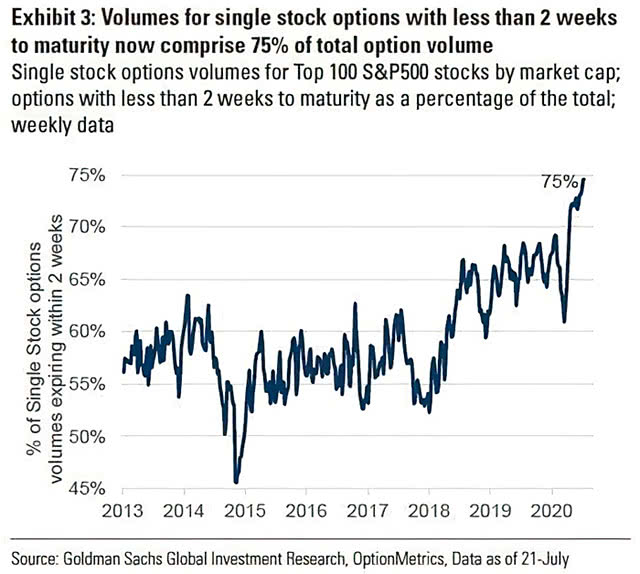
Traders have taken notice. The "stocks only go up" mentality seems to have taken a firm hold, and last week we saw - yet again - a massive increase in speculative activity among the most leveraged contracts. These are contracts that are increasingly focused on extremely short-term moves, according to Goldman Sachs.
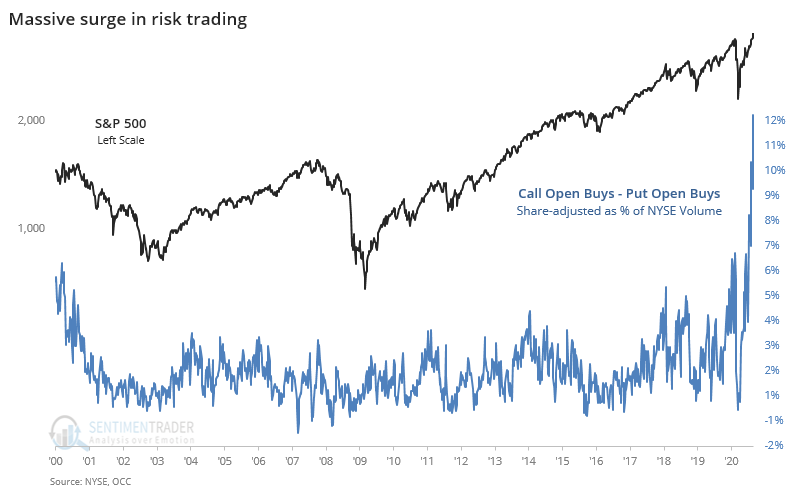
Among opening transactions for all customers on all U.S. exchanges, there were 22 million more call options than put options bought last week. That's higher than the prior record set in June.
What's more notable is that overall stock volume dropped last week, as the last week in August is often among the slowest of the year. As an equivalent share of total volume, this speculative activity went through the roof.
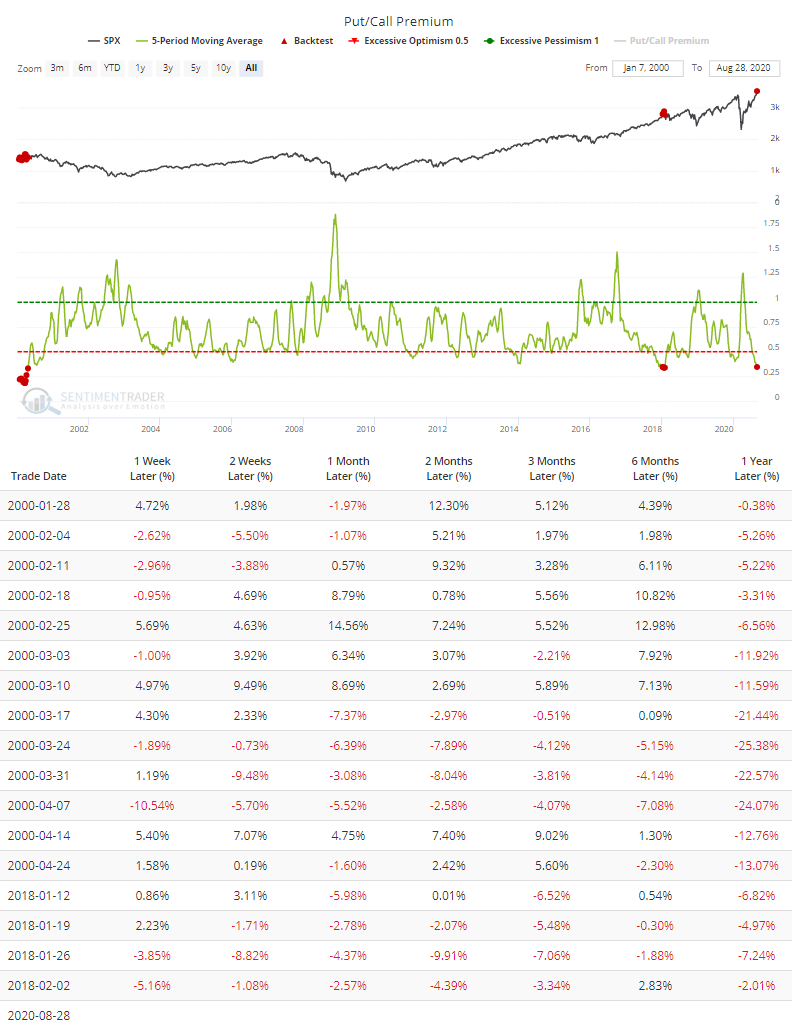
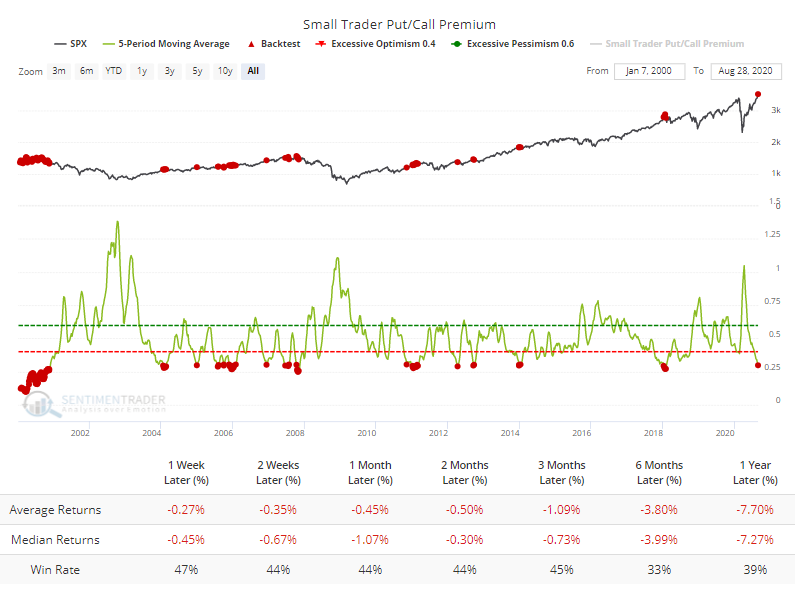
Over the past 5 weeks, the premiums that traders have paid for call options are about 3 times greater than the premiums they've paid for puts. The Backtest Engine shows how rare it has been to see this much money being put toward the opposite strategies, and how the S&P 500 fared afterward.
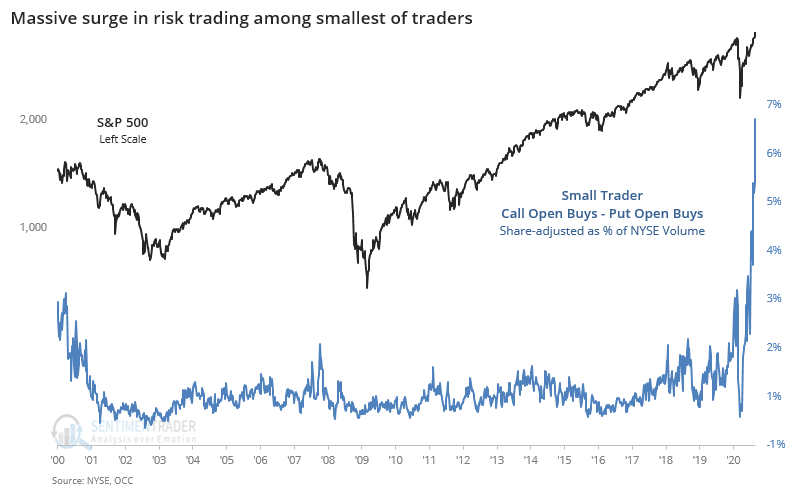
If we focus on just the smallest of traders, then it's the same pattern with an even more extreme stretch versus the prior record in February. They continue to focus on speculative call options and have pulled back greatly on protective puts. This is an insane chart.
We've never seen anything like this. Not even remotely. Granted, the data only go back to 2000, so perhaps in 1999, it would have been even more aggressive. That's doubtful, though, since early 2000 saw some of the most speculative readings of the entire bubble period.
Small traders have spent an average of more than 3 times as much for call vs. put premiums over the past 5 weeks. That has been (slightly) exceeded in the past but is still rare, and still led to very poor returns.
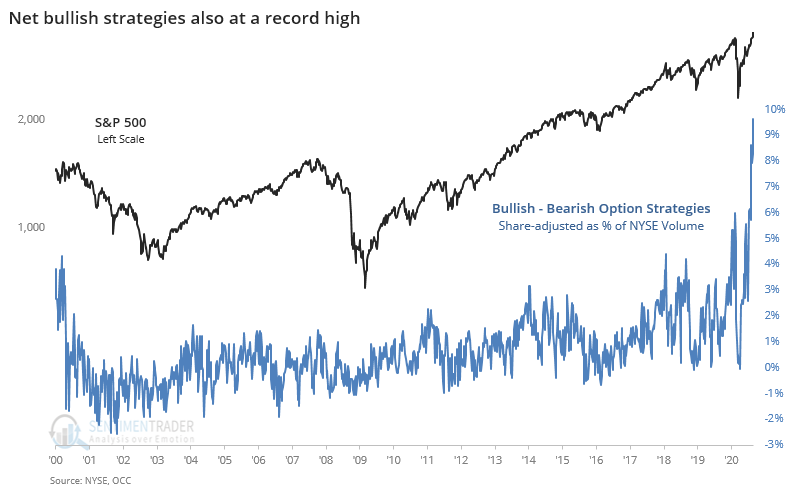
It's not like these opening buys were offset by other strategies that might show some tempered enthusiasm. If we add up all the bullish transactions (call buying + put selling) and net out the bearish ones (call selling + put buying), then it still surged to a record high. This is just a slightly different way of looking at the Options Speculation Index.
Perhaps there is some structural reason for this massive spike in activity. There are discussions about it being simple stock replacement, traders taking advantage of odd skews, and large brokers scrambling to balance their books due to intense volume in the largest tech stocks.
Whenever some of this data fails to lead to the expected outcome for a few weeks or more, we hear the usual chorus of opinions about why it doesn't work anymore. This has been consistent for 20 years, like...
- Decimalization will destroy all breadth figures (2000)
- The terror attacks will permanently alter investors' time preferences (2001)
- The pricking of the internet bubble will forever change option skews (2002)
- Easy money will render sentiment indicators useless (2007)
- The financial crisis means relying on any historical precedents are invalid (2008)
- The Fed's interventions mean any indicators are no longer useful (2010 - present)
All of these sound good, and for a time it seemed like they were accurate. Then markets would revert and the arguments would get swept into the dustbins of history.
Nobody knows if "something" has permanently changed. That's why we focus a lot on failures. And yes, clearly markets have gone longer and further than they historically have under similar conditions. And yes, it's possible that the fiscal and monetary stimuli, coupled with the breadth thrusts, recoveries, and trend changes from the spring mean that there will be little or no weakness for months on end. Dunno. It's just at a point, and admittedly has been for a while, where risk appears very high relative to likely reward over a medium-term time frame.