
Once a generation liquidation event

Once a generation
Pure, unbridled panic. There are really no other words for what markets witnessed on Thursday. The price action, market disruptions, and cross-asset volatility have been matched by few times in history.
It started as a run-of-the-mill, once-a-decade panic. And as long as that’s where it ended, things were looking positive over a medium-term time frame, even if we were in the midst of a protracted bear market.
The only comparison is post 9/11, and even that doesn’t do it justice. While some of the social reactions are similar, the breadth and depth of the selling pressure now exceeds what we saw even then. The opening price gaps this week exceed anything we’ve seen before when coming on the heels of already-high pessimism and price extremes.
This is some kind of hybrid monster mashup of 1987 and 9/11 and October 2008.
So, all historical precedents must be taken with a grain of salt. While the assumption that investors behave more or less consistently over time is a defensible one, so far this go around has been violating formerly reliable patterns.
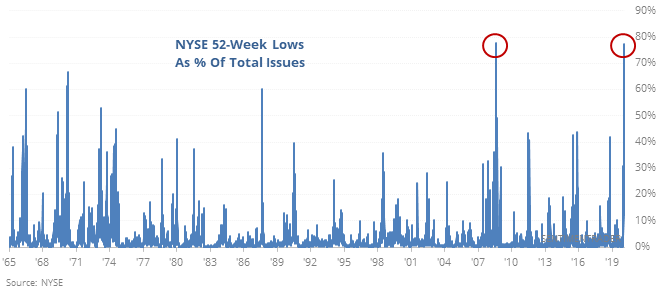
Those patterns had (and have) suggest that the type of selling pressure seen in recent days is similar to a few other liquidation events over the past 50 years. That kind of thing is what sparks new lows in thousands of securities on the same day.
One of the challenges of using mean reversion and historical extremes is the “extreme can always get more extreme” trap. That’s what we’re seeing now. All the (very few) historical precedents suggest a relief rally over the coming months, but they were suggesting the same thing last week.
Fear is at a maximum
Fear is at a maximum right now. The kind of selloff we witnessed on Thursday can only be compared to some of the worst crashes in market history: October 2008, 1987, and 1929-1932.
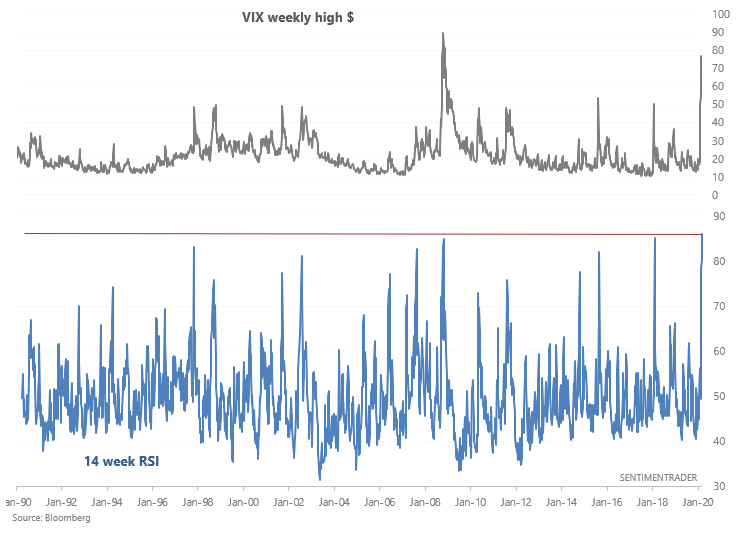
VIX's weekly RSI (using CLOSE $) is at 85, which is even higher than the worst of the 2008 crash. Granted, the week isn't over, so we'll have to use VIX's weekly HIGH $:
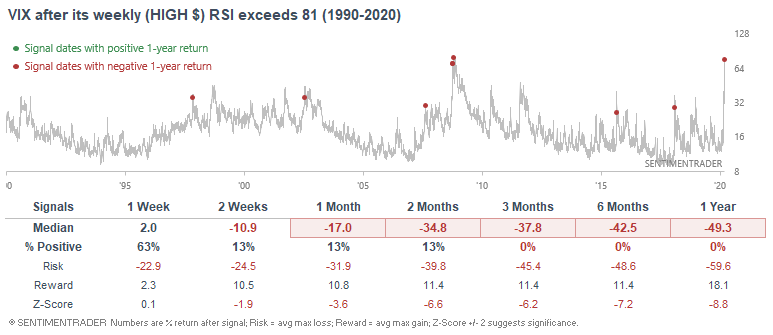
Here's what happened next to VIX after its weekly RSI exceeded 81:
 This is an abridged version of our recent reports and notes. For immediate access with no obligation, sign up for a 30-day free trial now.
We also looked at:
- What it means when stocks suffer their worst days
- Thursday was the worst-ever loss when already at a 52-week low
- New lows on the Nasdaq hit a record high
- For one of the few times ever, we saw consecutive 95% down days
- The "old VIX" is showing among the most fear ever
- Dumb Money Confidence is at a record low
- More than half our indicators are showing pessimism
- Safe havens fell along with stocks
- A near record number of stocks are oversold
- In Europe, it is a record
- What happens after the dollar becomes so volatile
- A majority of individual investors are pessimistic