
Oil's loss, Nasdaq's gain

Key points:
- Monday's negative reversal in crude oil prices ranked among the largest in history
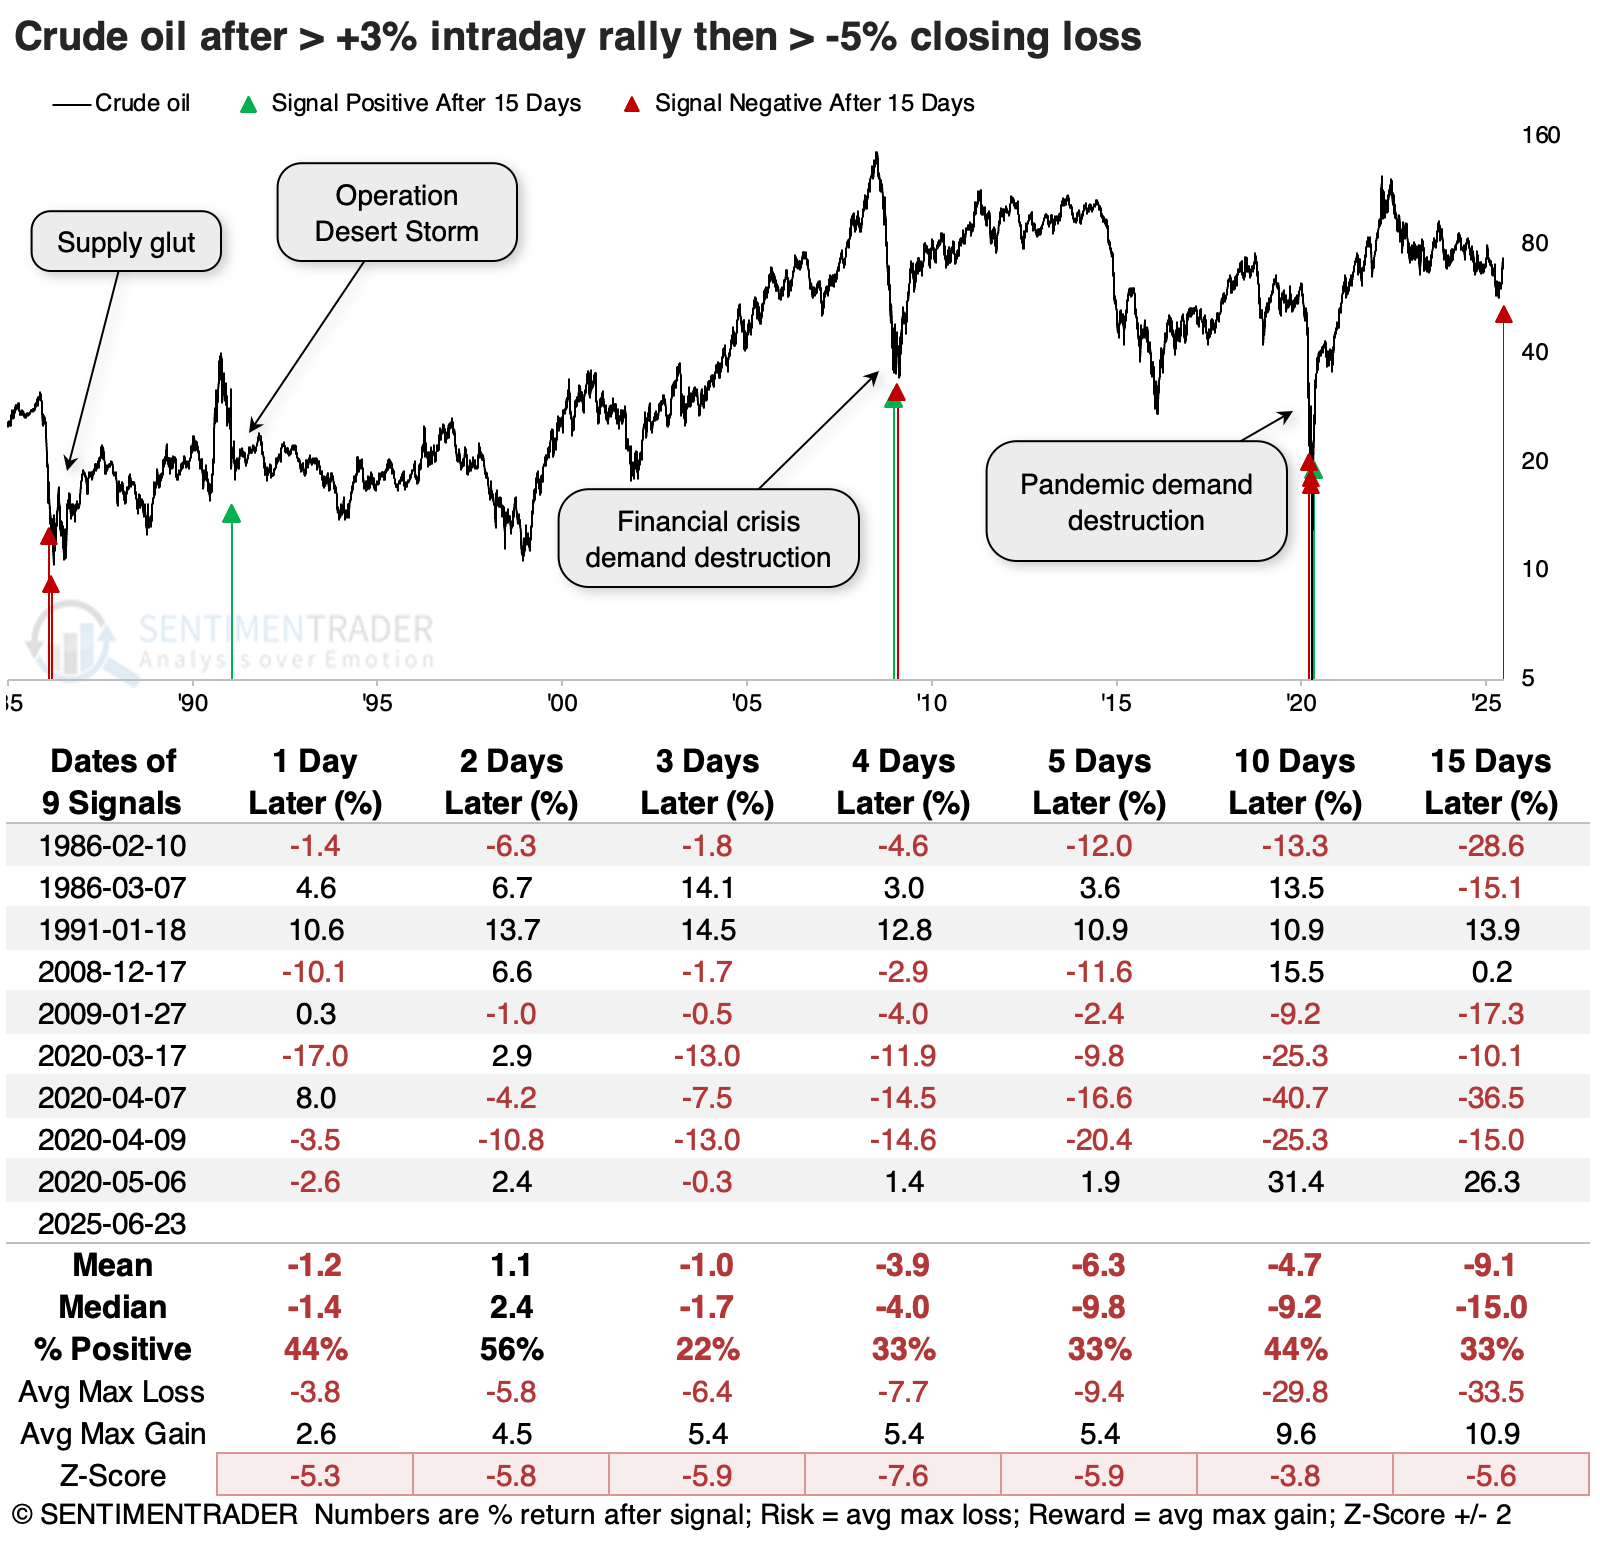
- After large negative intraday reversals, oil tended to decline over short time frames and rebound after
- The high volatility tended to benefit stock indices, especially the Nasdaq Composite
A bad day for black gold
After years of malaise and some long-awaited relief in June, oil bulls thought they finally had their moment. A war in the Middle East is their dream scenario (assuming their thoughts of profits supersede the nightmare of human suffering).
It didn't last long.
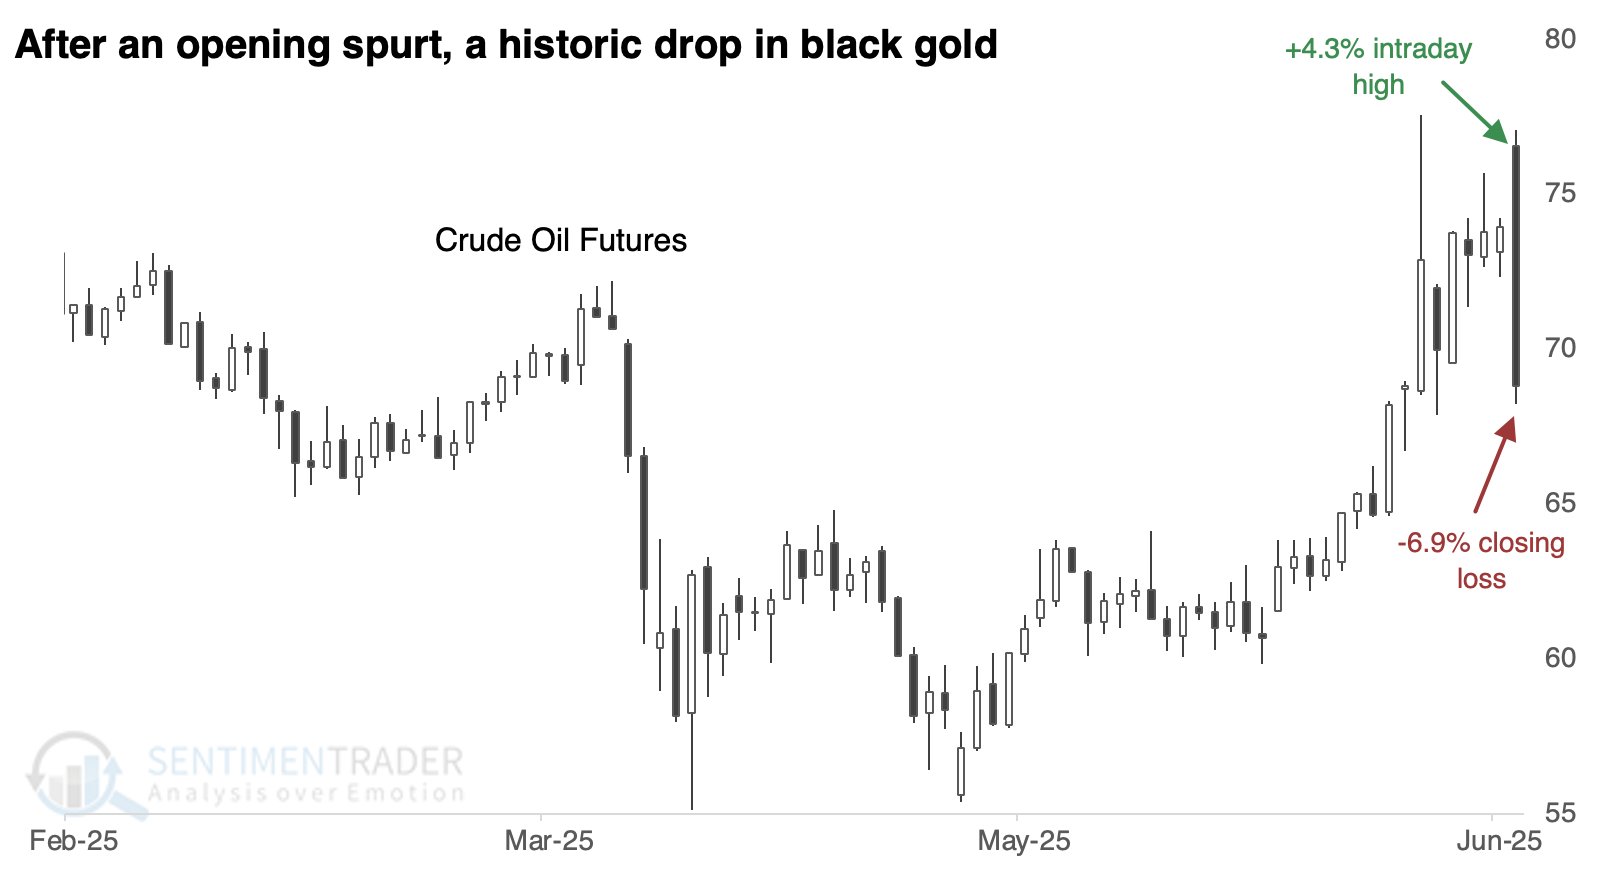
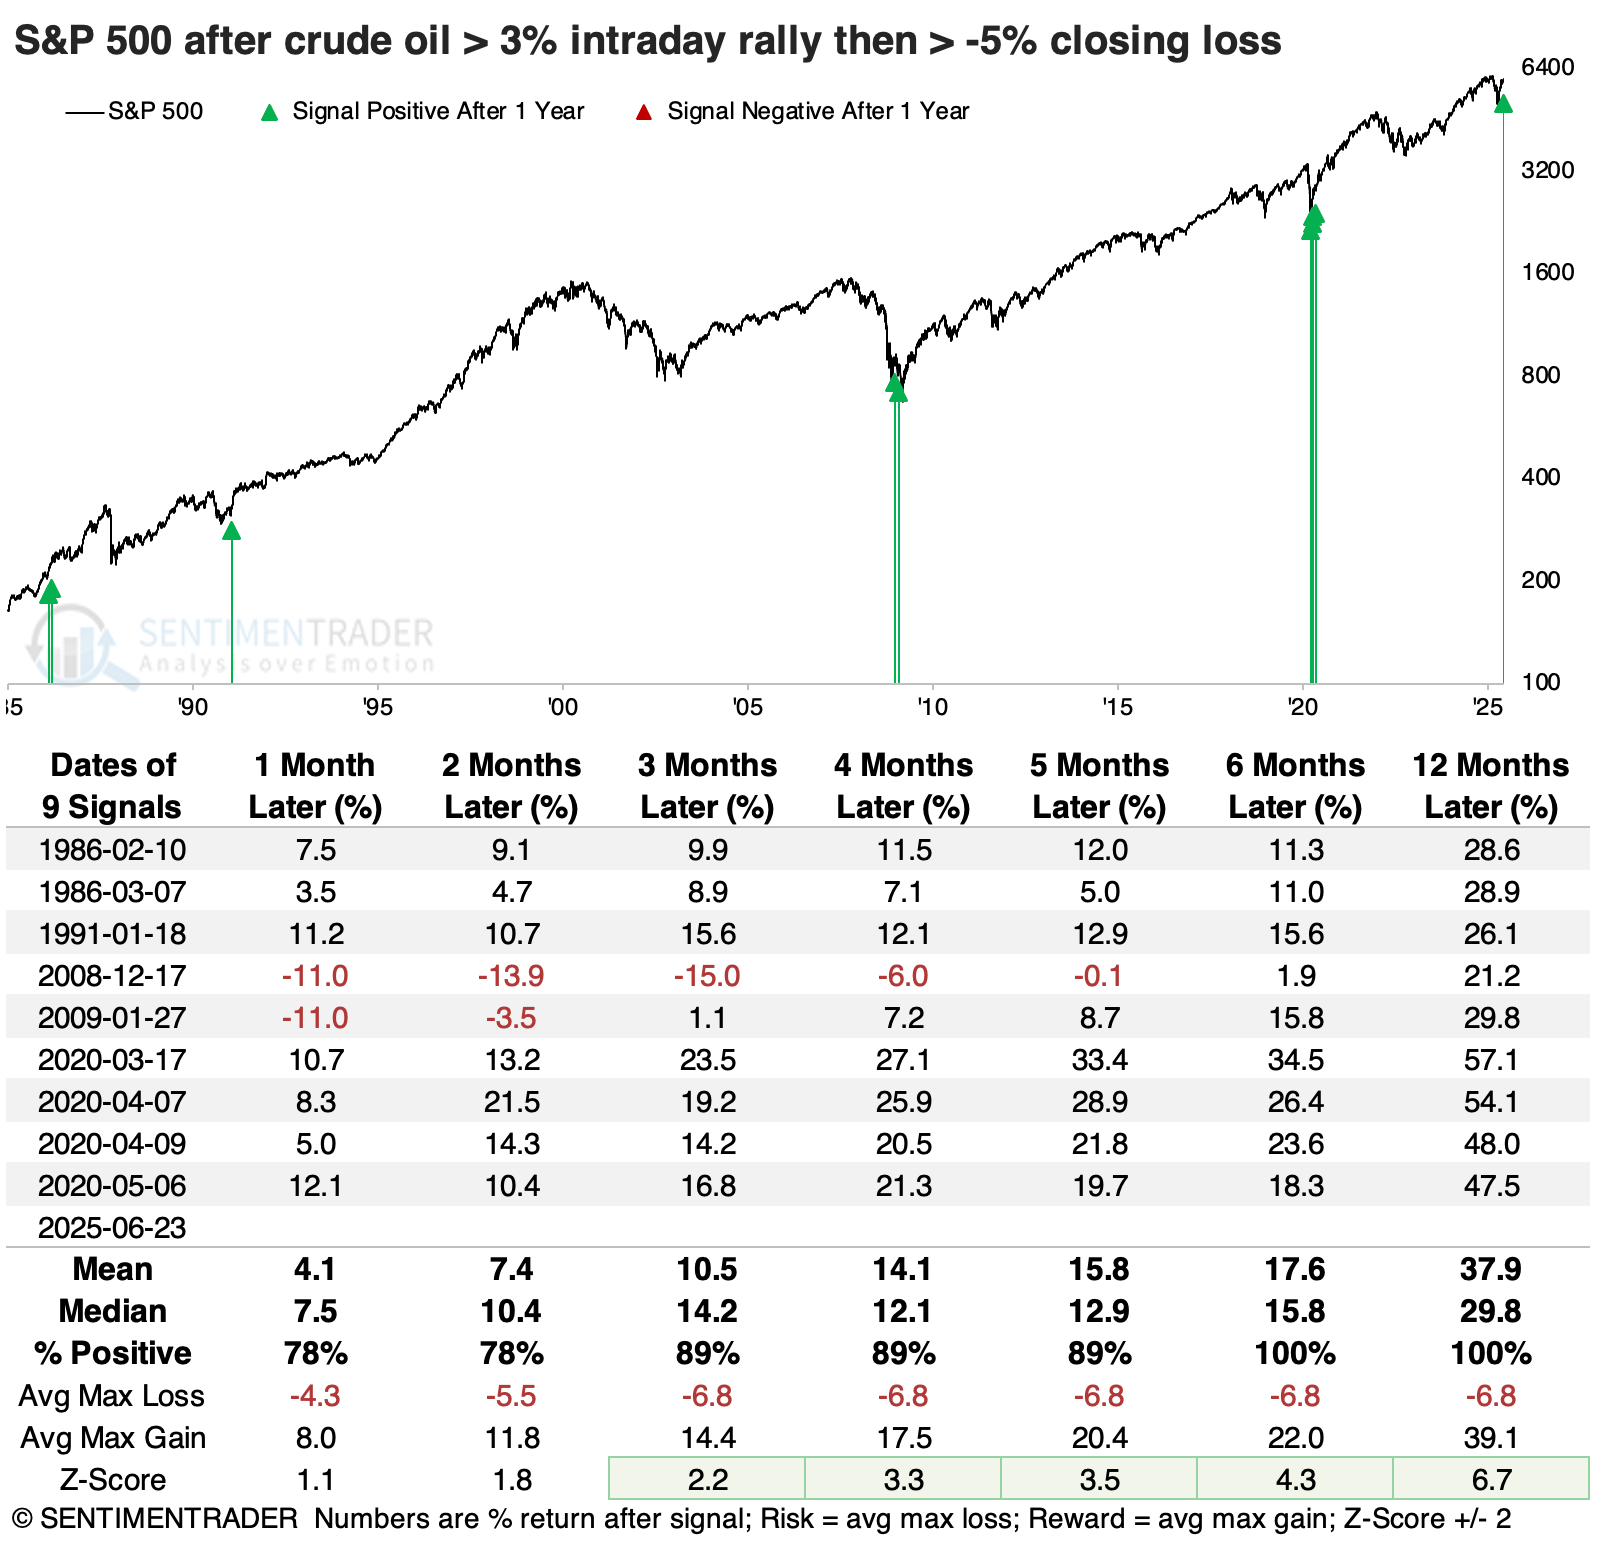
For the first time since historic volatility during the COVID pandemic, and a few times outside that havoc, oil more than reversed a large intraday rally. There have only been a handful of times the contract rallied more than +3% intraday, only to close more than -5% below its prior close.
These bearish outside reversals have tended to stick over short time frames. By initial indications, that has happened so far again this time, with another loss on Tuesday.
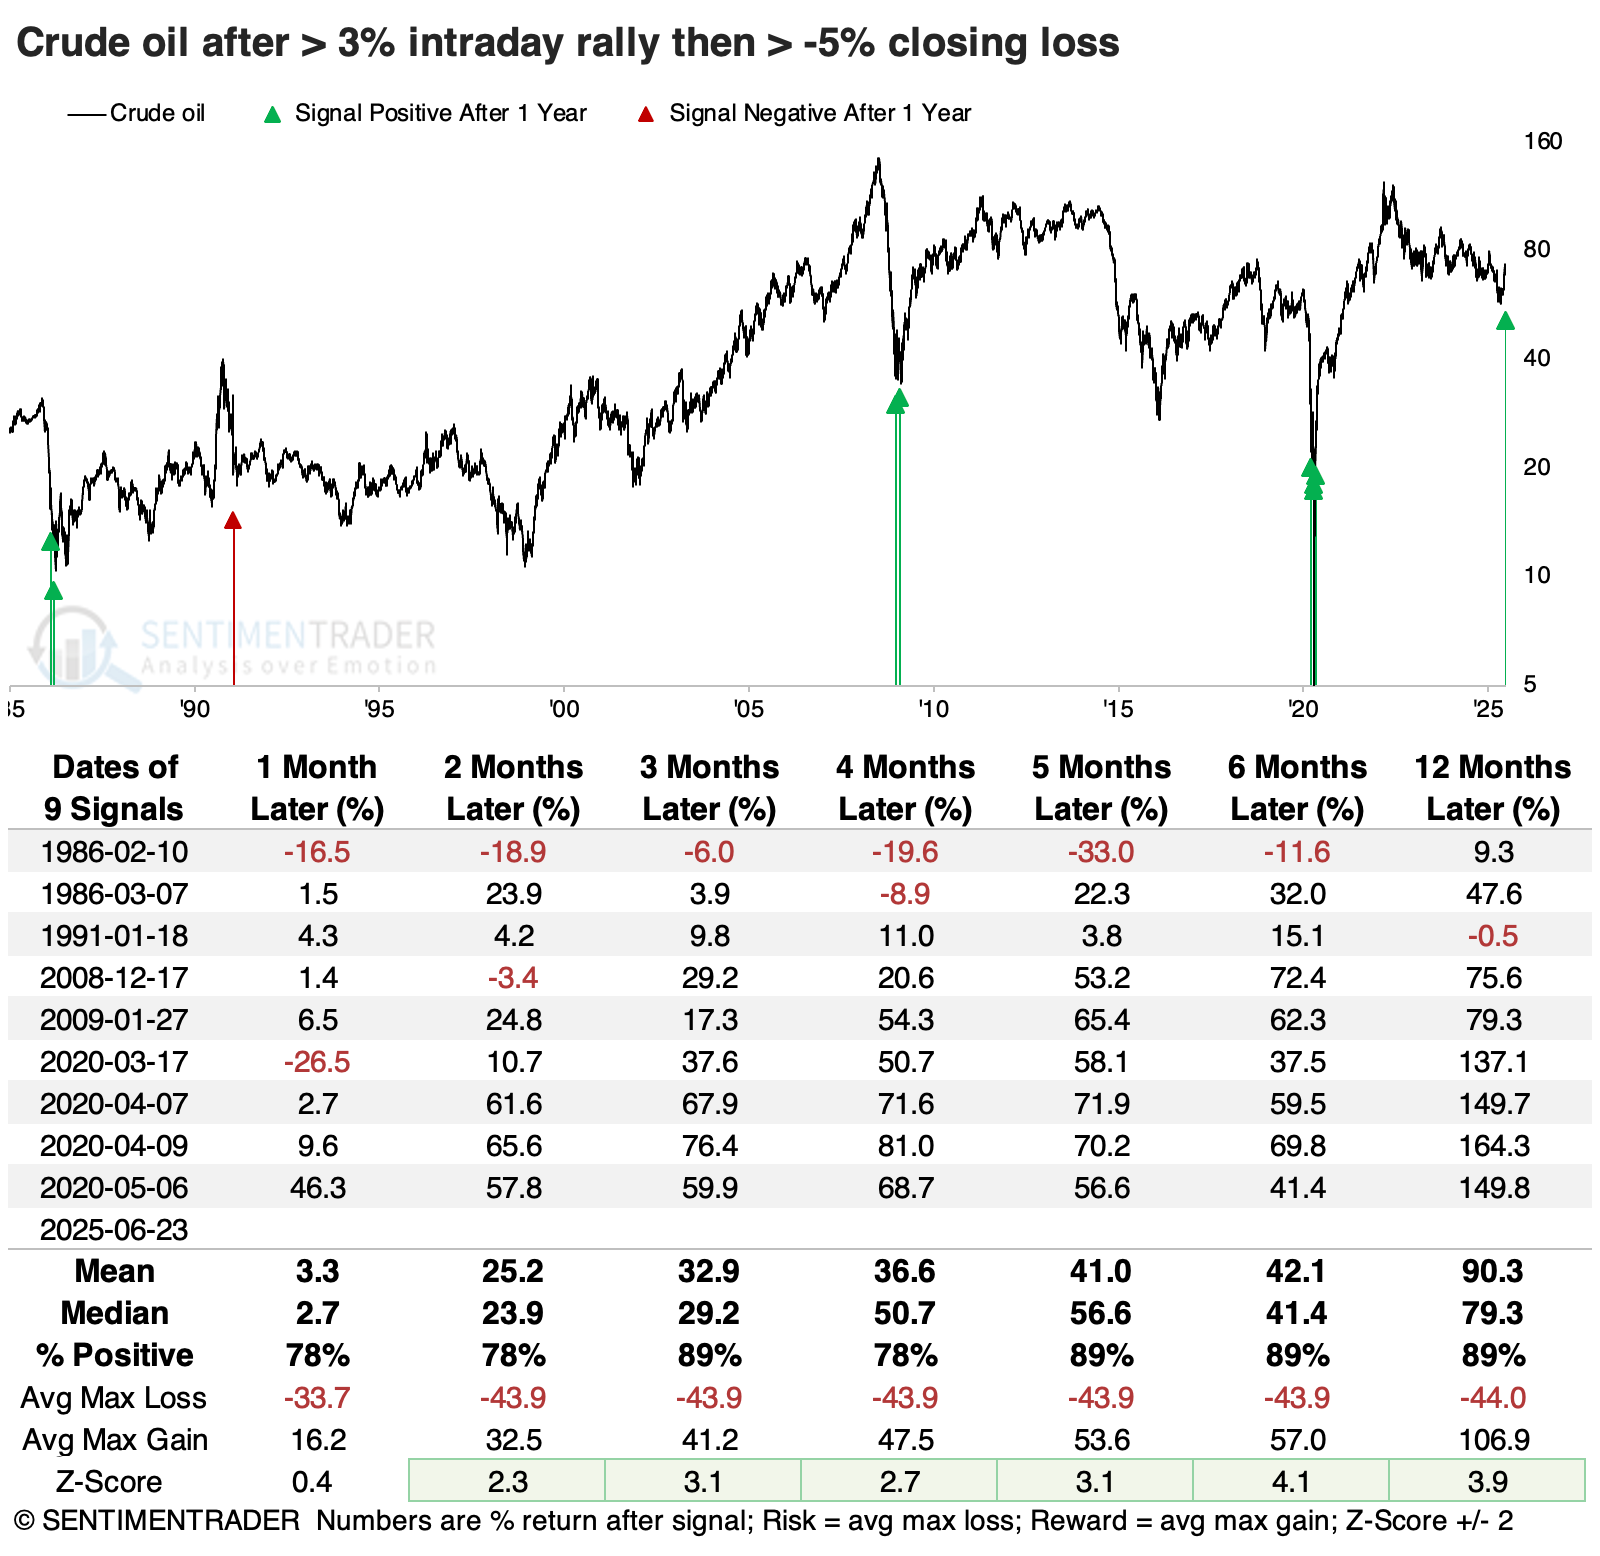
Over longer time frames, the initial losses tended to be reversed more often than not. By three months later, crude oil futures were higher 8 out of 9 times.
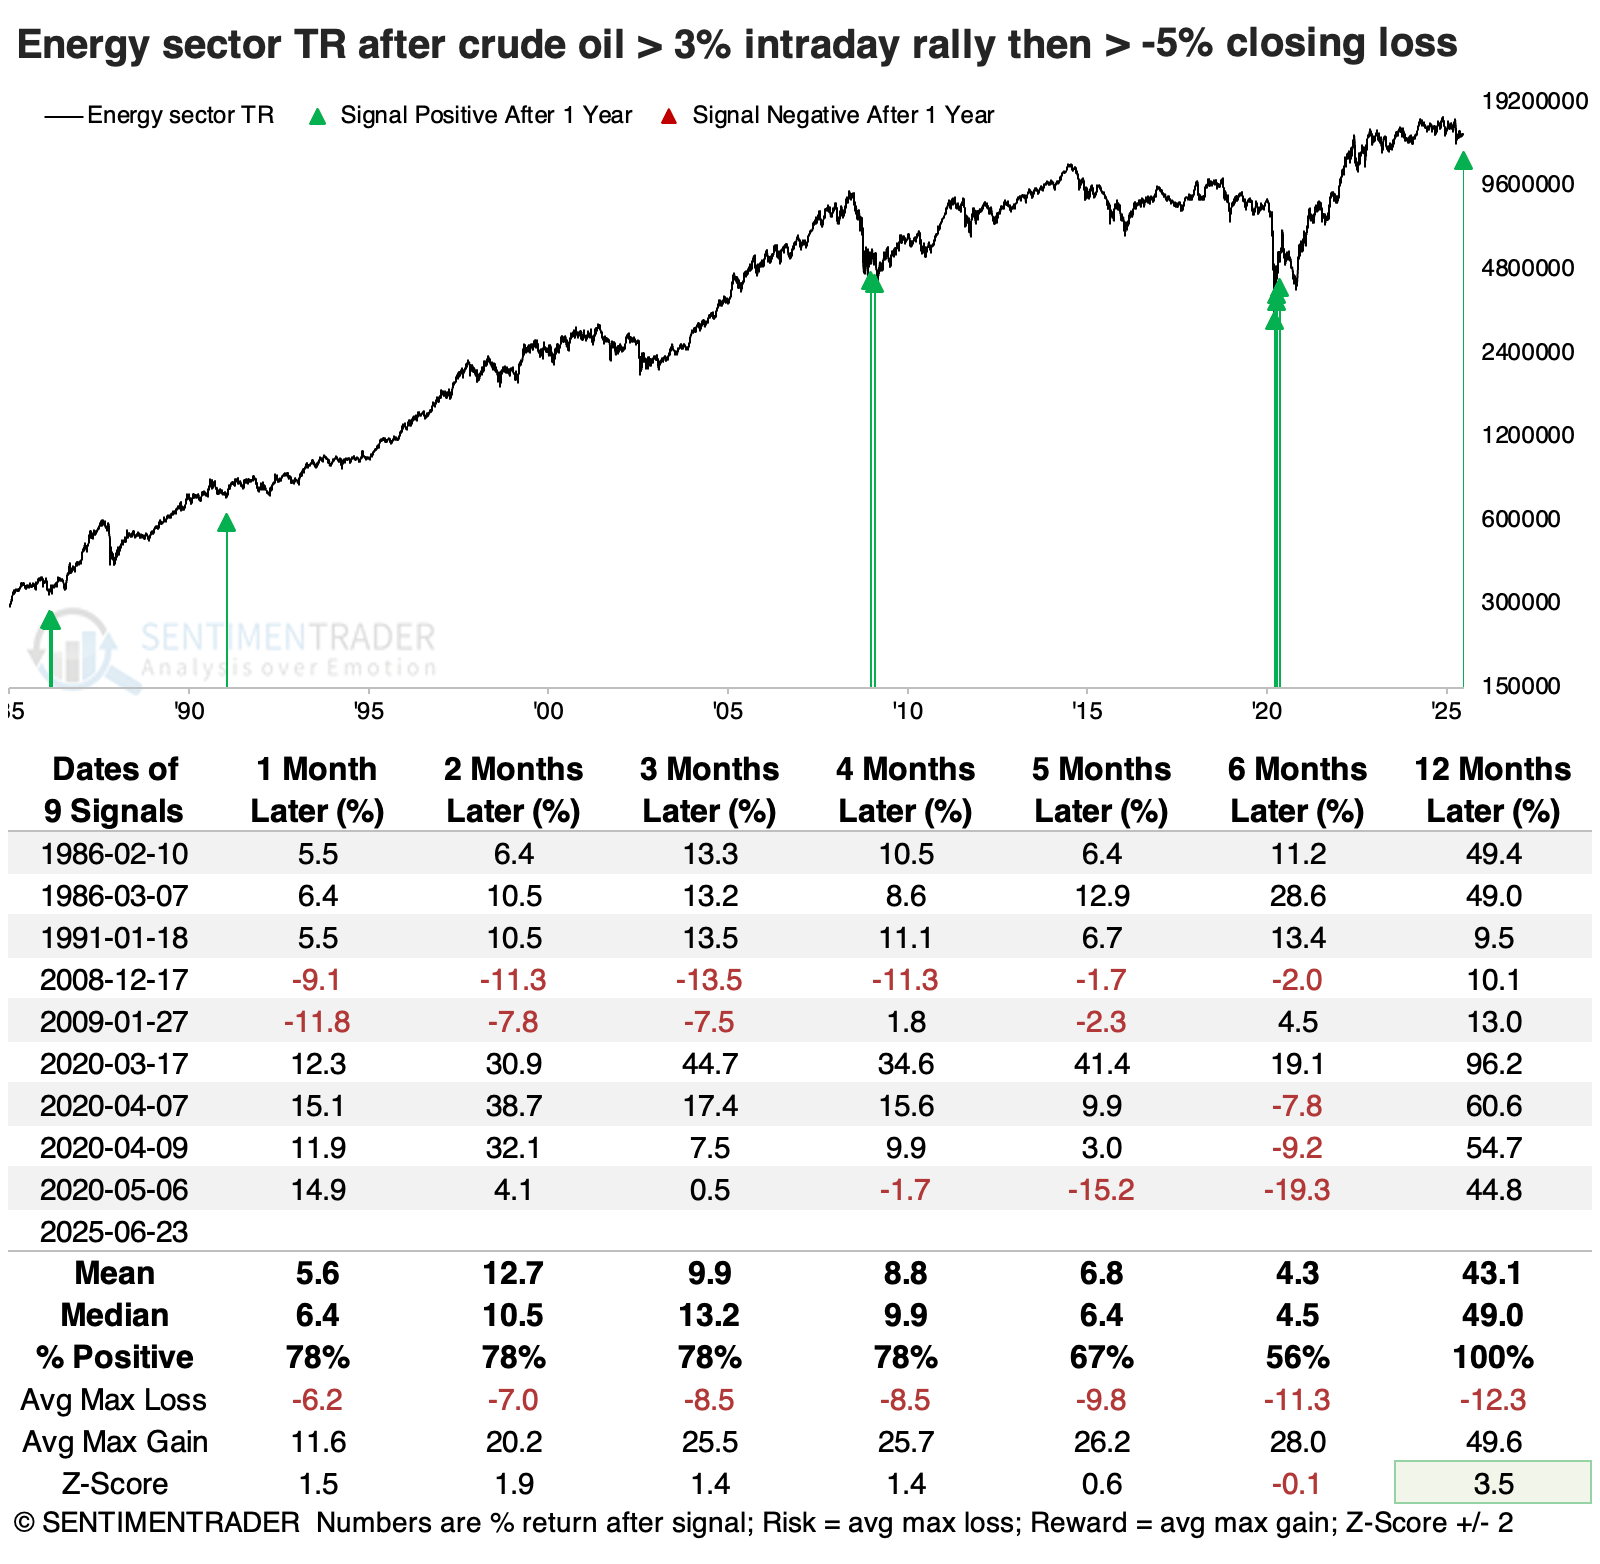
Energy stocks also tended to show gains, though not as consistently or impressively. Even so, the sector gained 100% of the time over the following year.
The broader S&P 500 did even better in consistency; the S&P witnessed a minimum gain of +21.2% over the following year.
Smaller reversals were still good for stocks
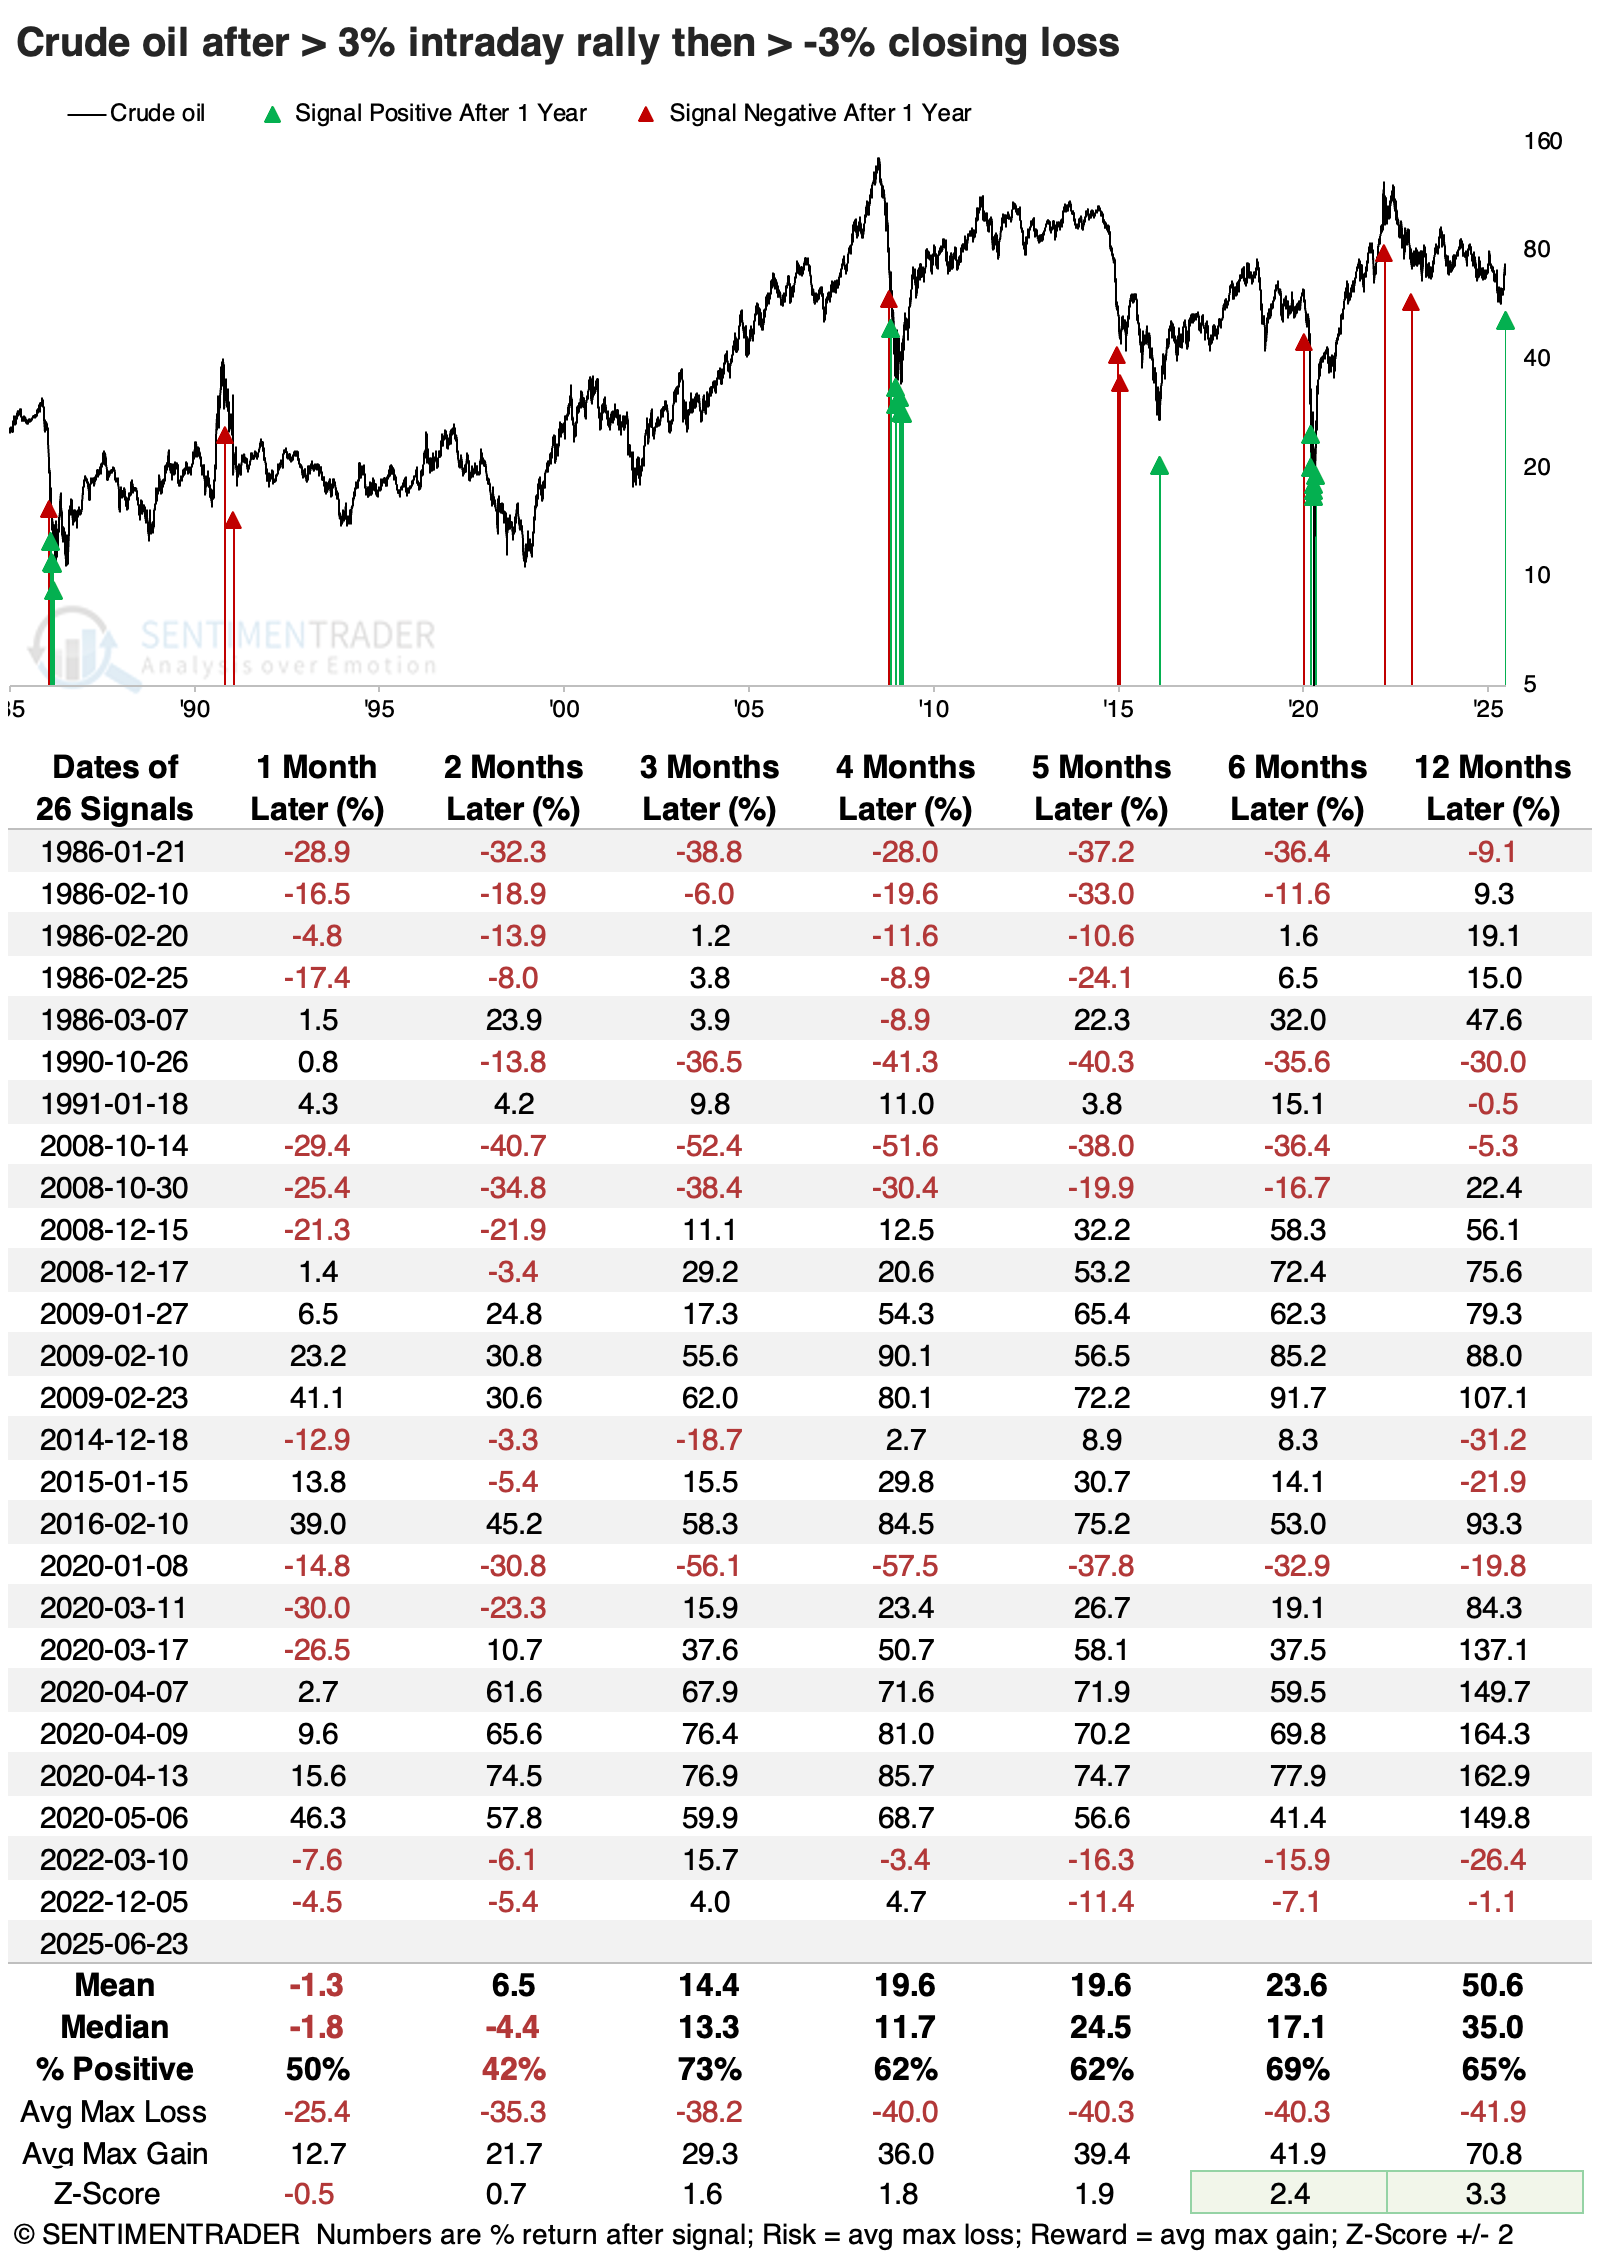
It's difficult to rely on a small sample size, especially when several dates are clustered together. The table below shows crude oil's returns when it turned a +3% intraday rally into a -3% loss by the close (instead of a -5% loss). Returns were unimpressive over the next couple of months, but tended to rebound in the month(s) after that, especially since 2008.
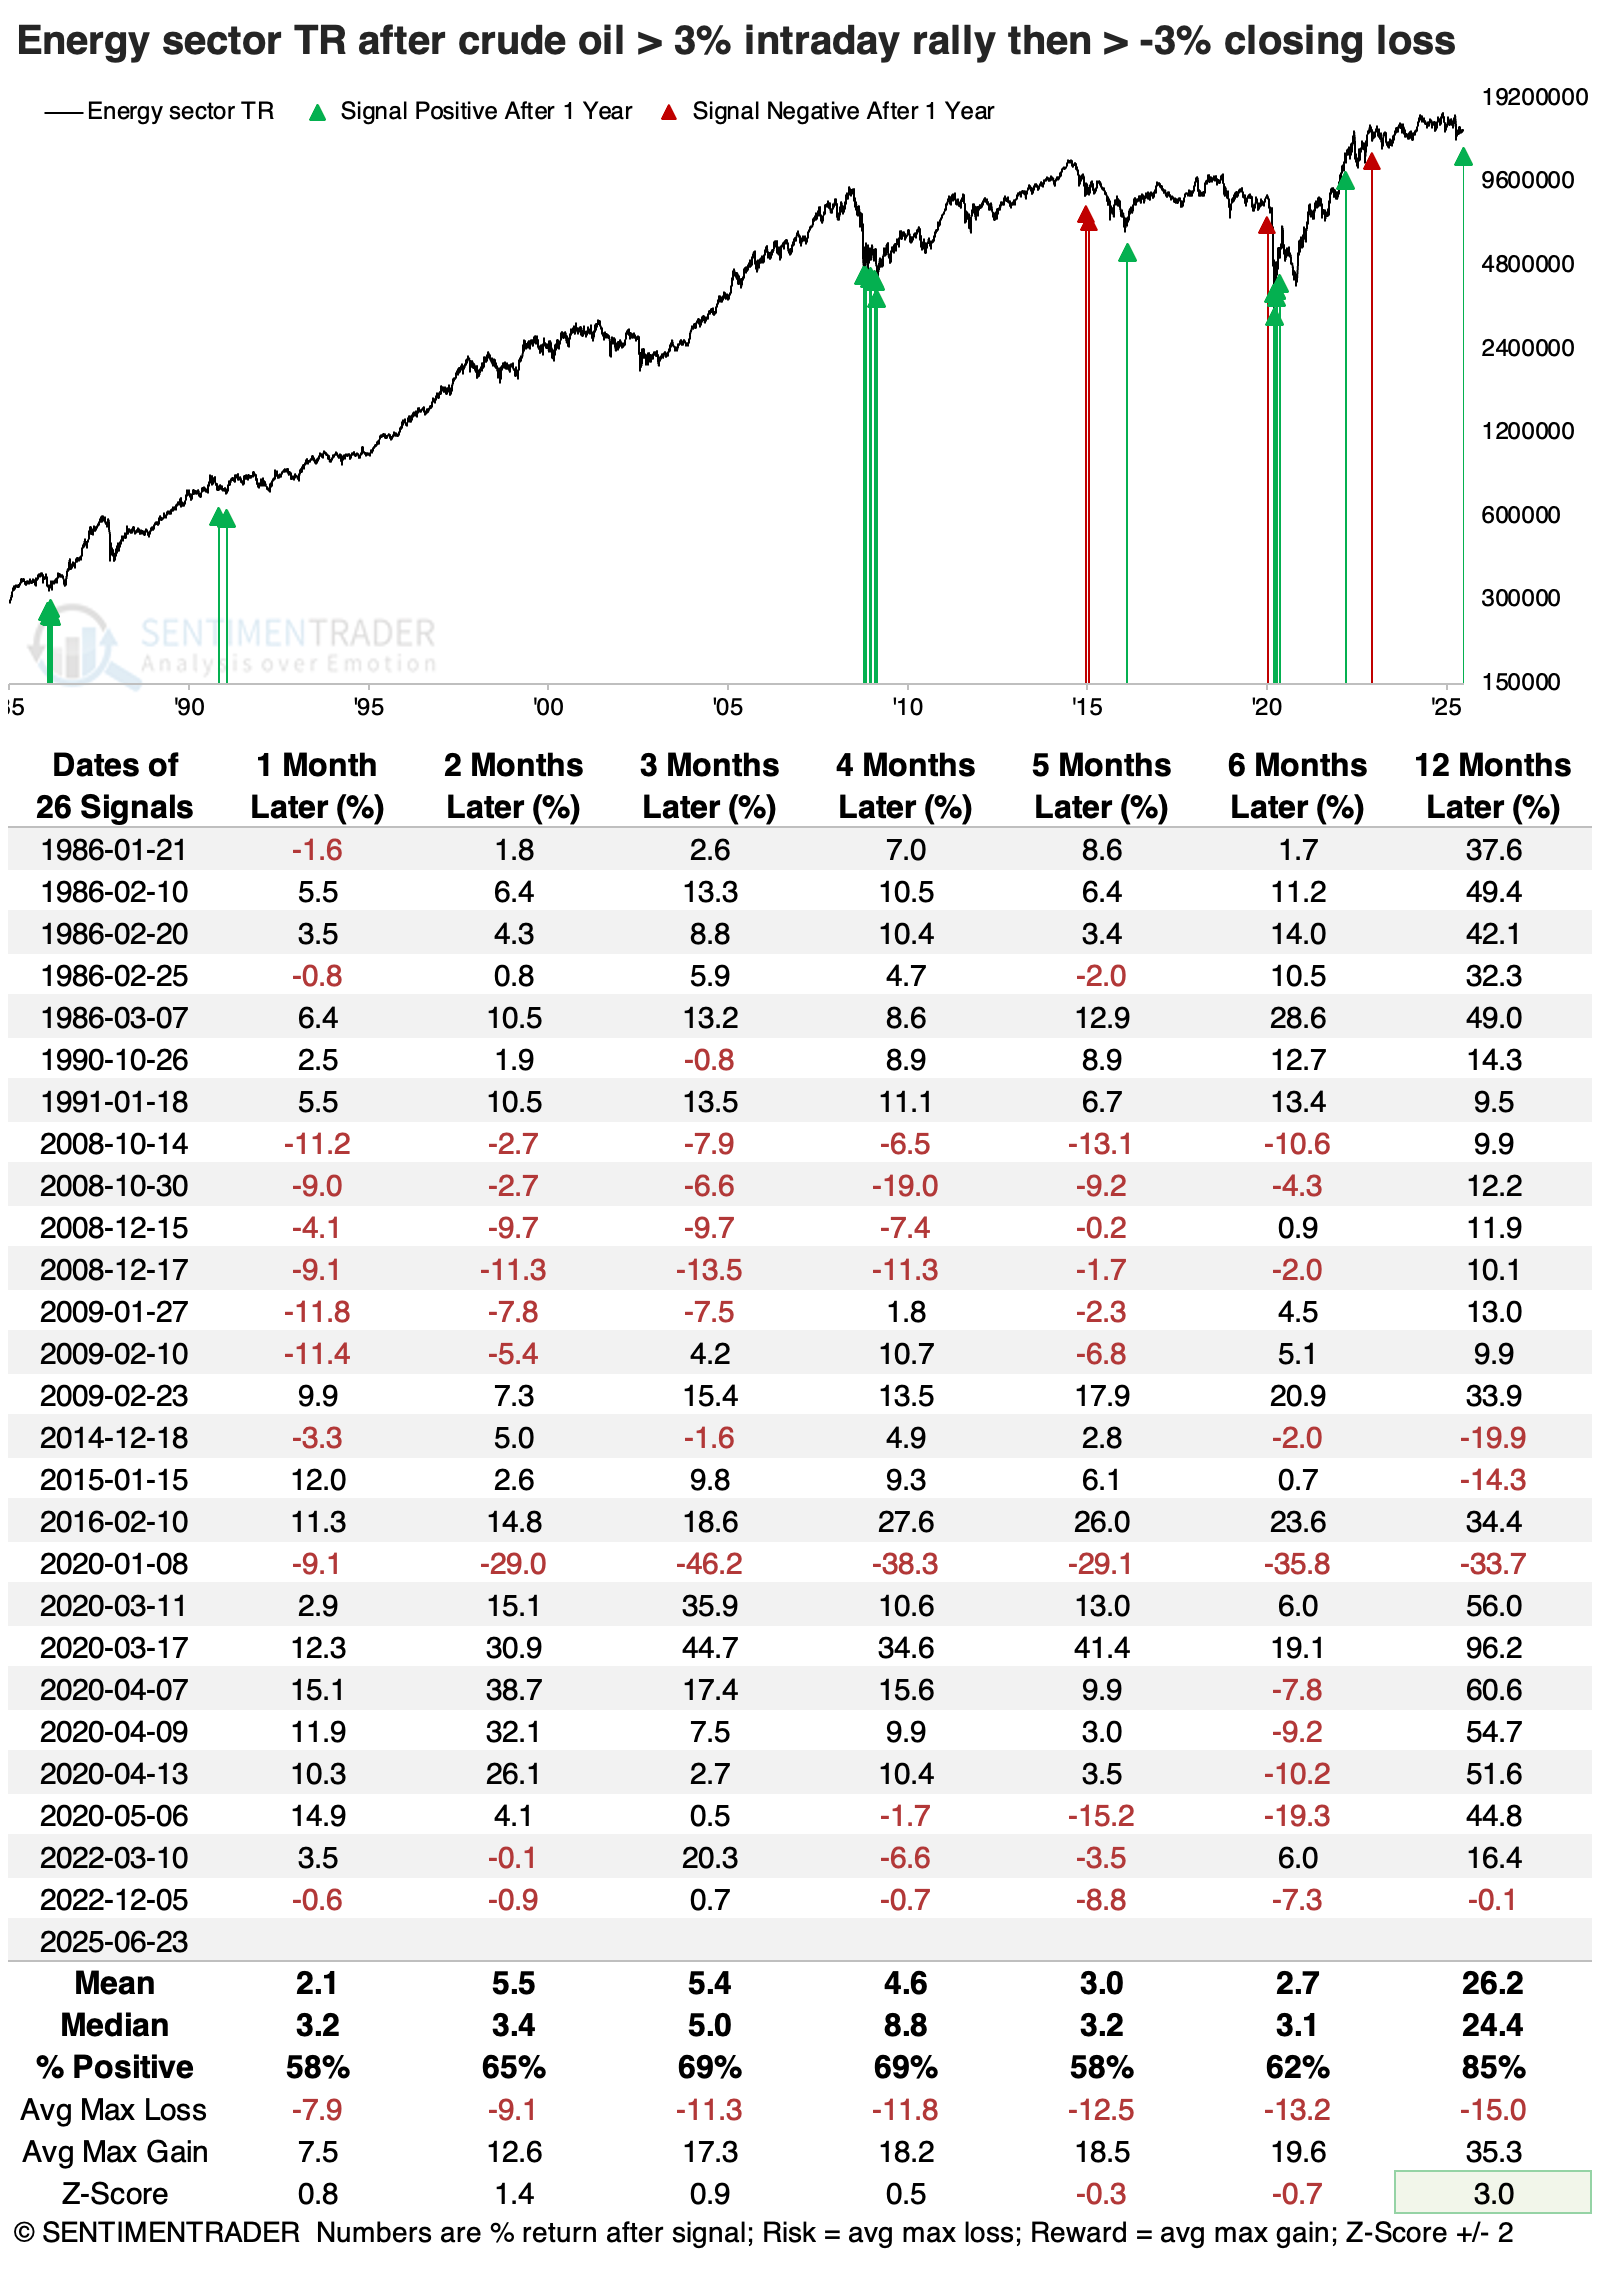
Energy stocks saw less consistent weakness over shorter time frames and averaged a one-year return of +24%, significantly above a random return.
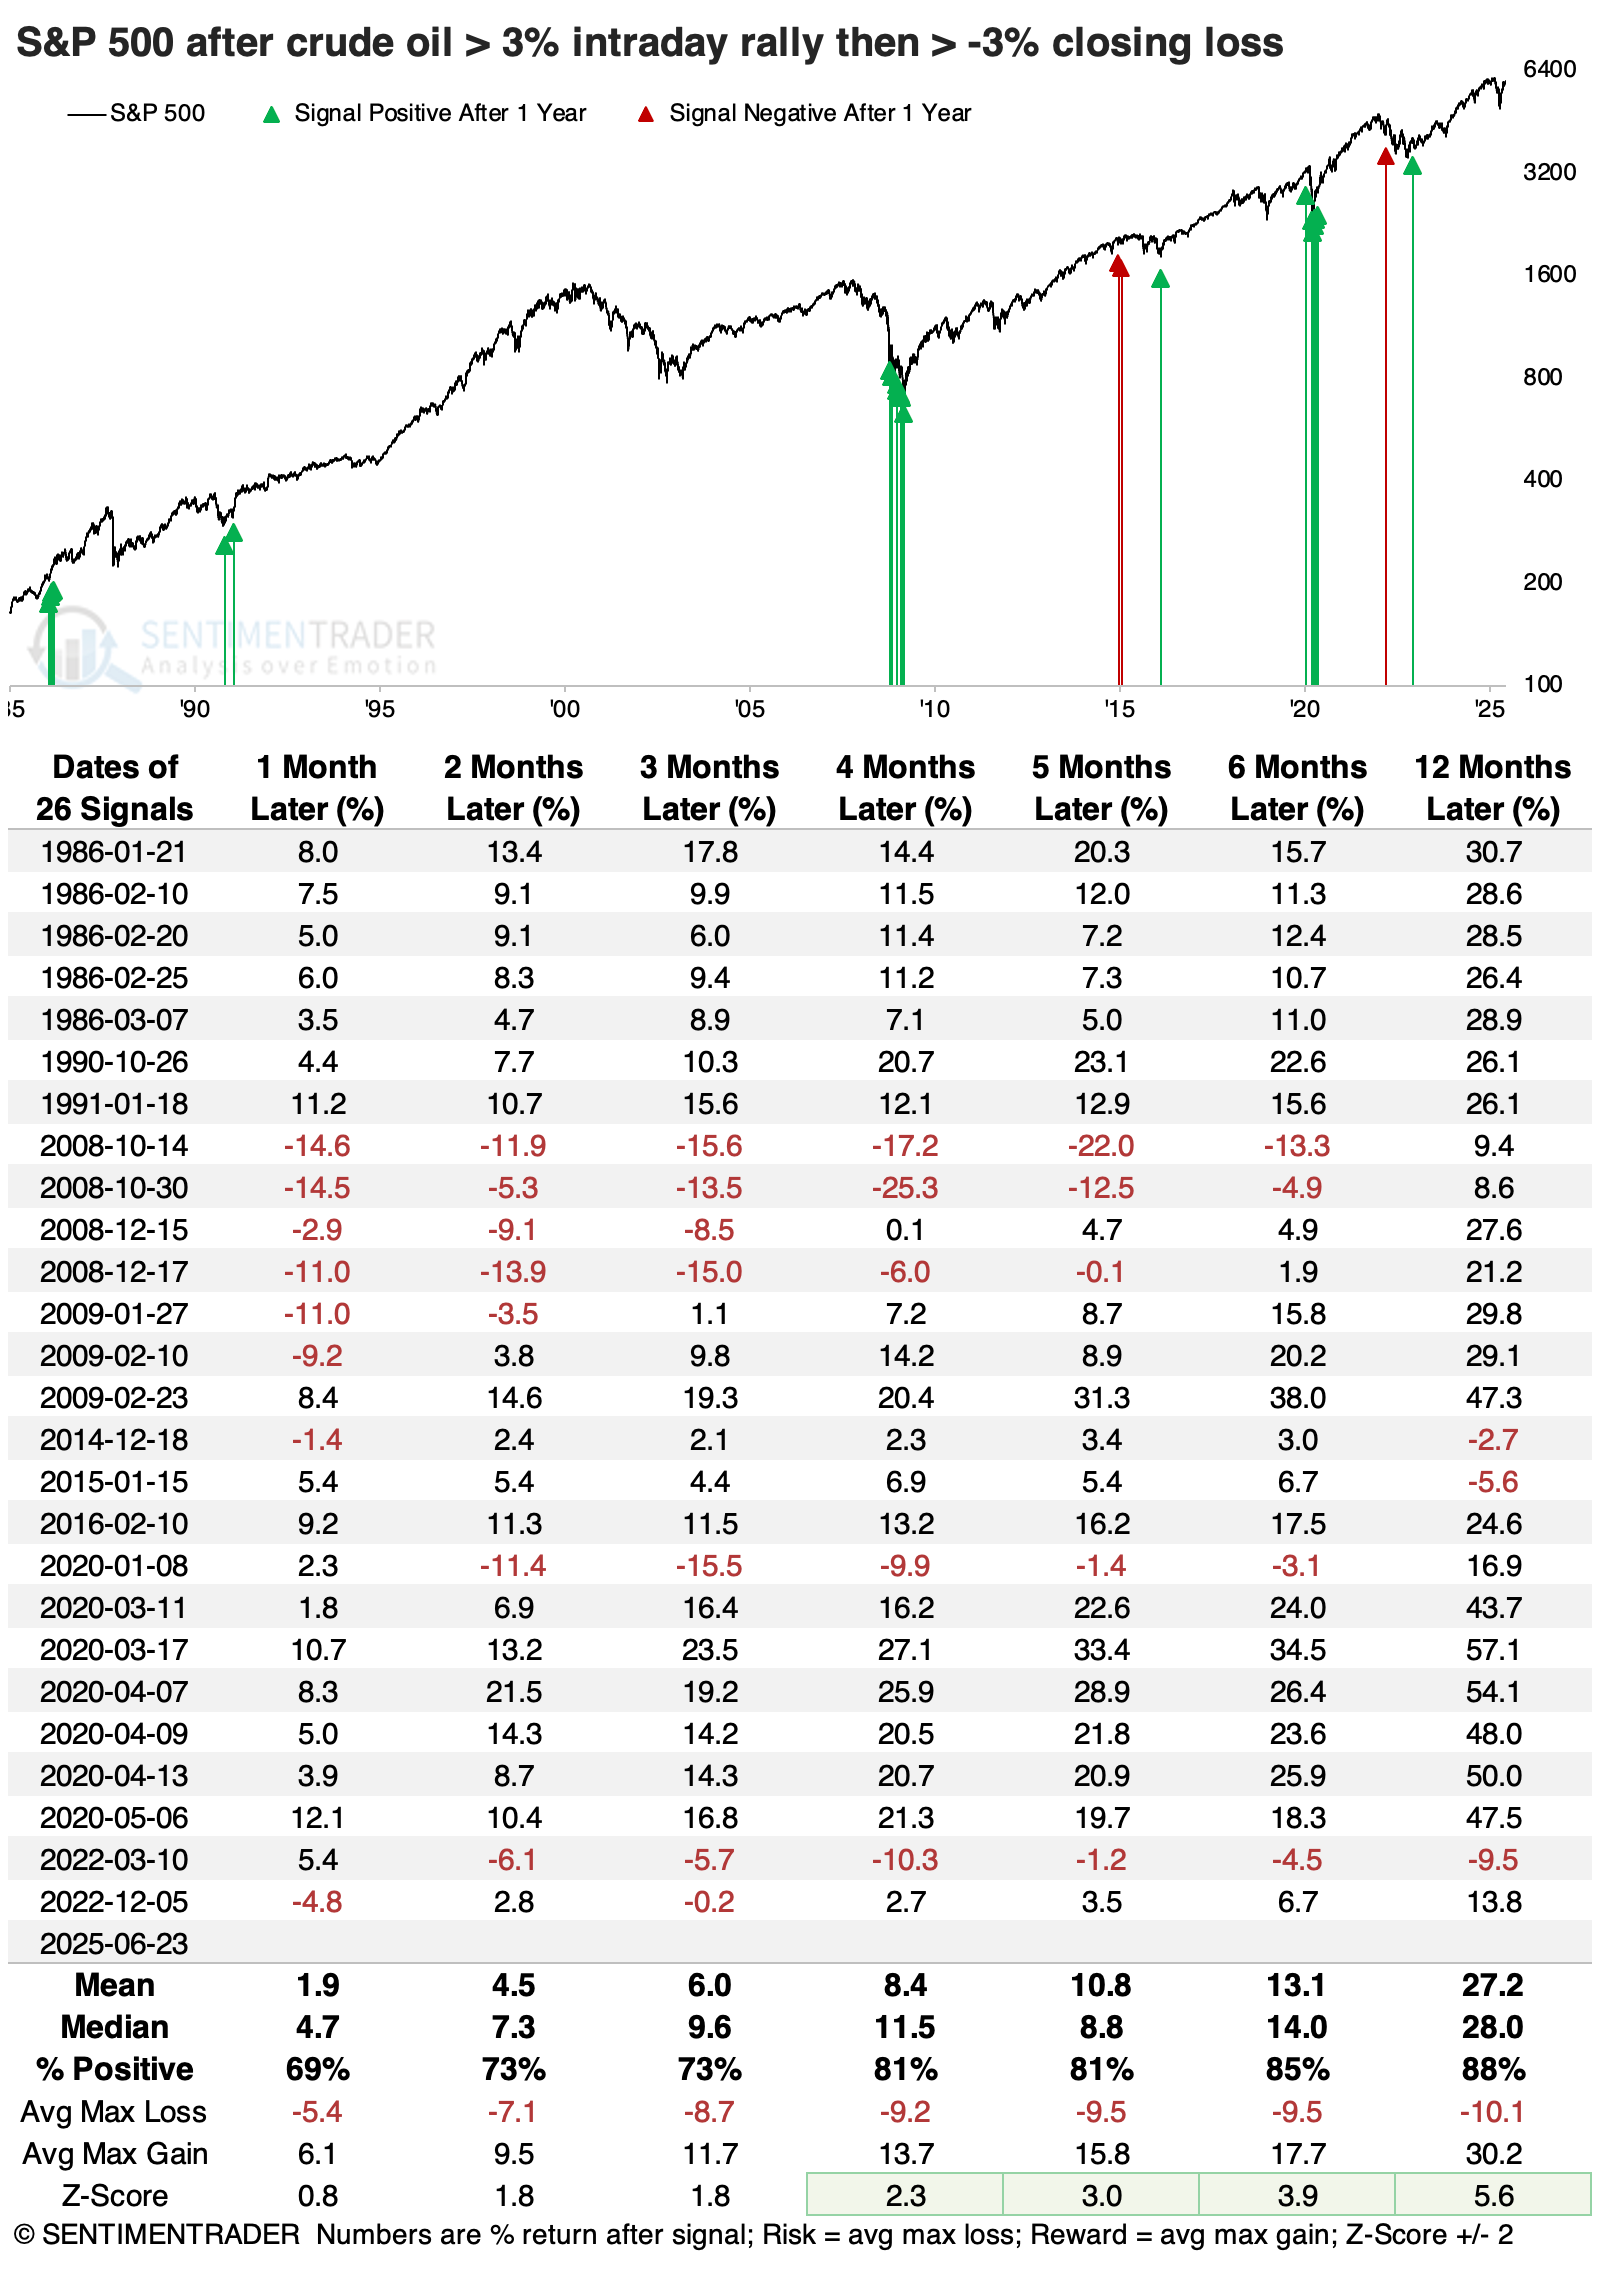
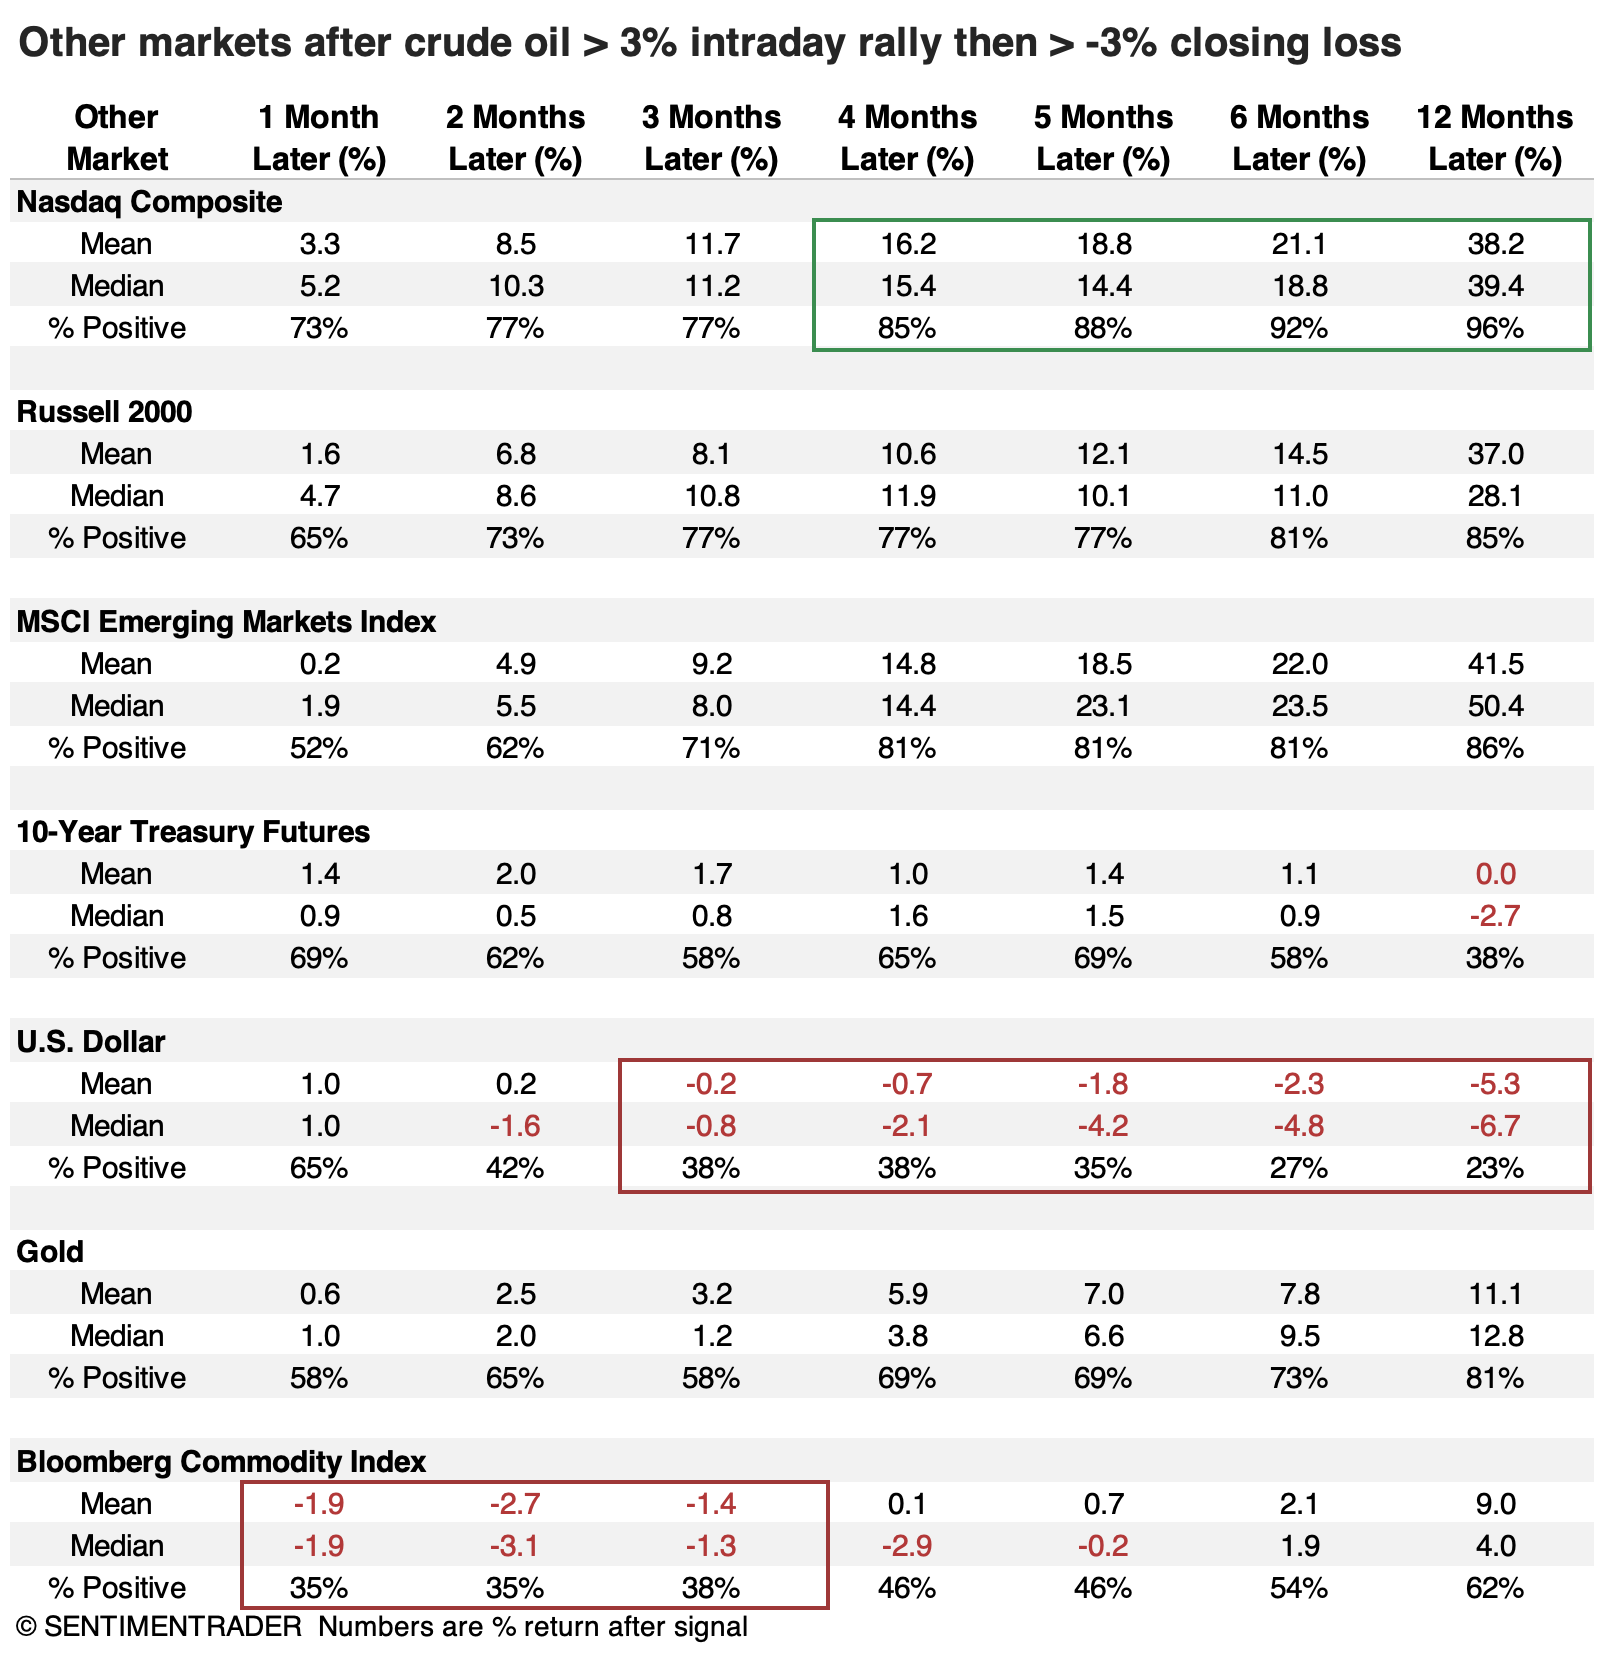
Once again, the S&P 500 tended to be an even bigger beneficiary of these negative reversals in oil prices. From four months and beyond, the index was higher more than 80% of the time, with average returns well above random.
The Nasdaq Composite performed even better than the S&P 500 over all time frames, with an impressive average gain and win rate during the next 6-12 months. Over shorter time frames, a broad commodity index tended to get pulled down along with crude oil, and early rallies in the U.S. dollar showed a strong tendency to peter out.
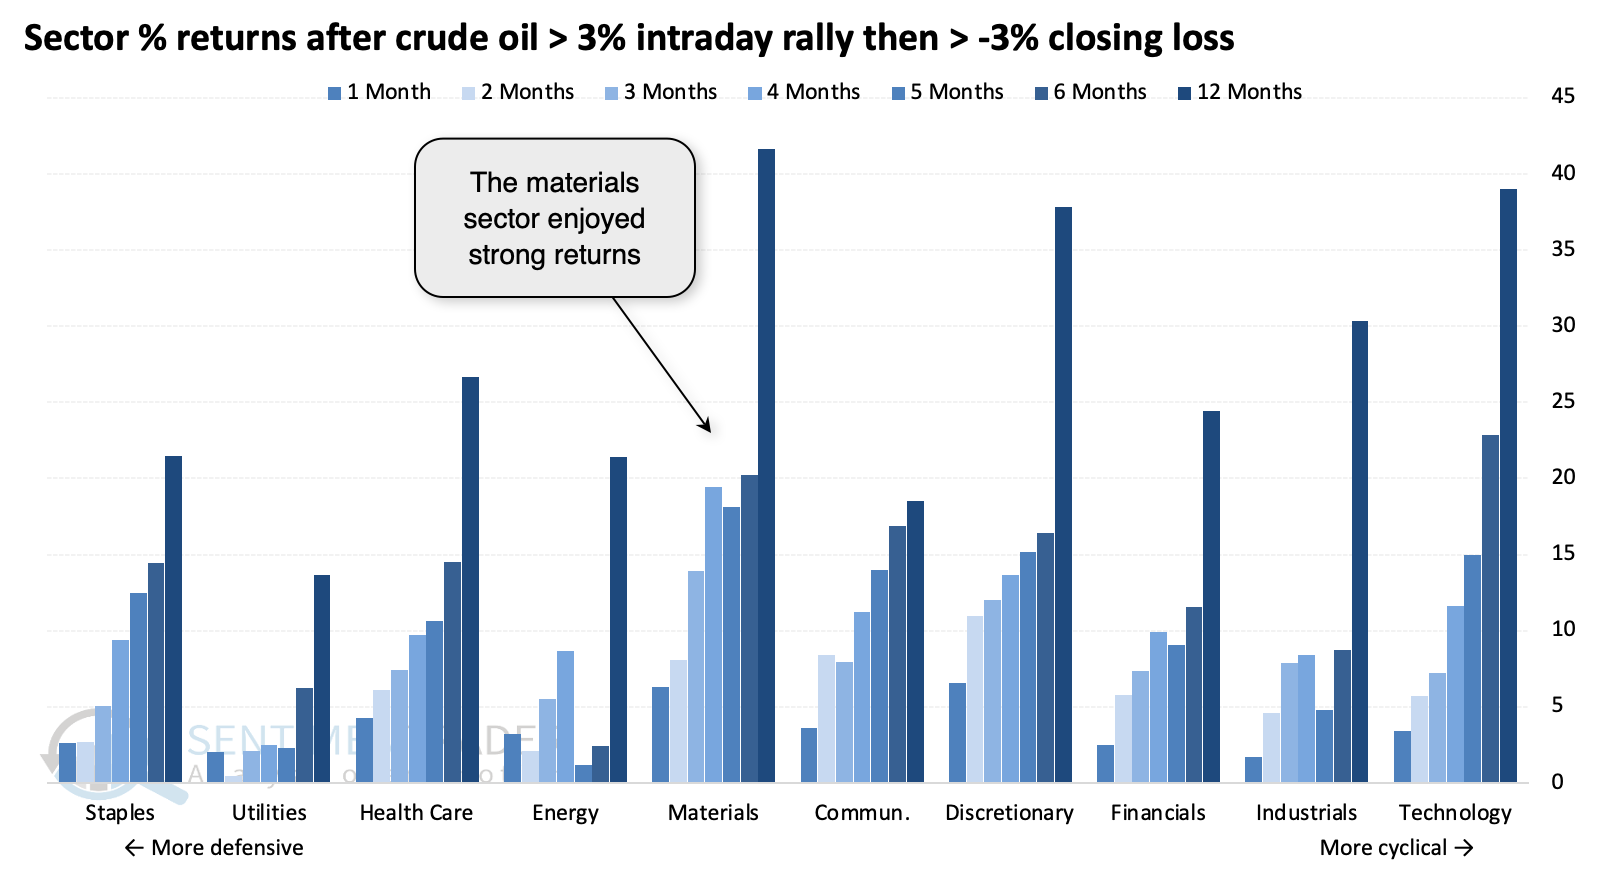
Among all sectors, the most consistently impressive performer was materials. This makes sense, as lower oil prices reduce significant cost input for these chemical, construction materials, containers and packaging, metals and mining, and paper and forest products companies.
What the research tells us...
We've long cautioned against reading too much into single-day reversal patterns, mostly in reference to the stock market. It gets less clear when we go outside the stock market, especially when the reversal is significantly outside the norm.
Looking at one-year returns following a one-day reversal pattern may be foolhardy, but the returns shown above were compelling enough to at least mention. Crude oil showed a strong tendency to continue its decline over short time frames of a few weeks or shorter. Still, these periods of heightened volatility showed a similarly strong tendency to rebound in the months following that. The drop in oil prices was a boon to stock indices, particularly higher-beta ones like the Nasdaq Composite.