
NYSE Percentage of New Lows and 200-Day Average Risk-Off Model

As I've stated numerous times in previous notes, new lows are a critical time series to monitor during bullish market trends. I use the series in several risk-off components within the TCTM Risk Warning Model. While it may seem redundant, I've found that I can improve my odds by casting a wide net as no single indicator will trigger at every market peak. I would also note that I have found that I can improve a model by including an additional time series with a slightly different duration. I plan to share how I use news lows and the percentage of members above the 200-day average to identify risk-off environments in today's note.
Components
1.) NYSE New Lows
2.) NYSE New Highs
3.) NYSE Common Stocks Percentage of Members above the 200-Day Moving Average
NYSE Percentage of New Lows and 200-Day Average Risk-Off Model
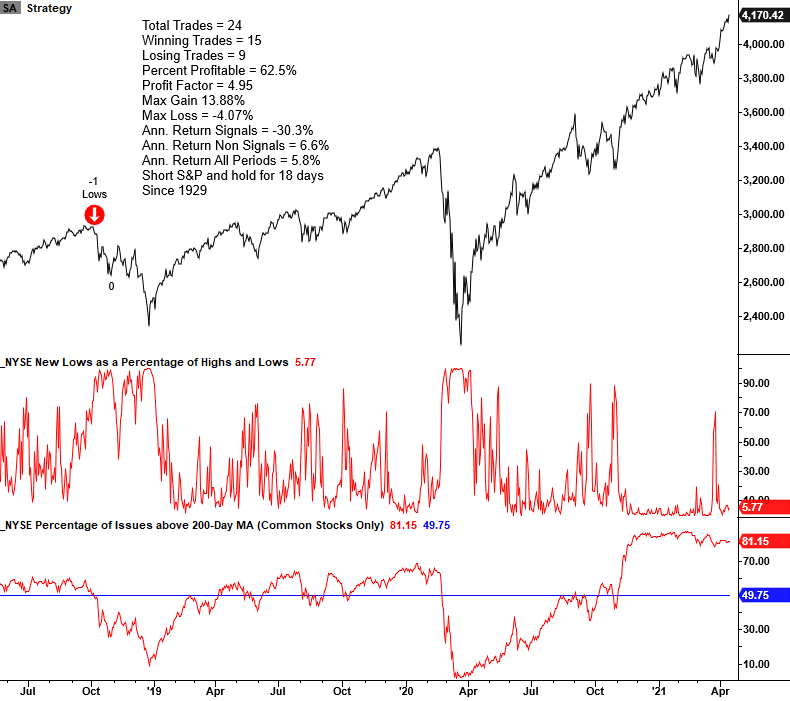
The NYSE percentage of new lows and 200-day average model seeks to identify instances in history when new lows are expanding, and the percentage of stocks above the 200-day moving average is low. The model will issue an alert based upon the following conditions.
Signal Criteria
Condition1 = New lows as a percentage of highs and lows cross above 79%.
Condition2 = Percentage of NYSE common stock members above the 200-day average <= 49.75%.
Condition3 = S&P 500 Index <= 4.5% from 252-Day High
Condition4 = Percentage of new lows resets below 10%. i.e., the reset screens out duplicate signals.
If Condition 1-4, signal risk-off.
Let's take a look at some charts and the historical signal performance.
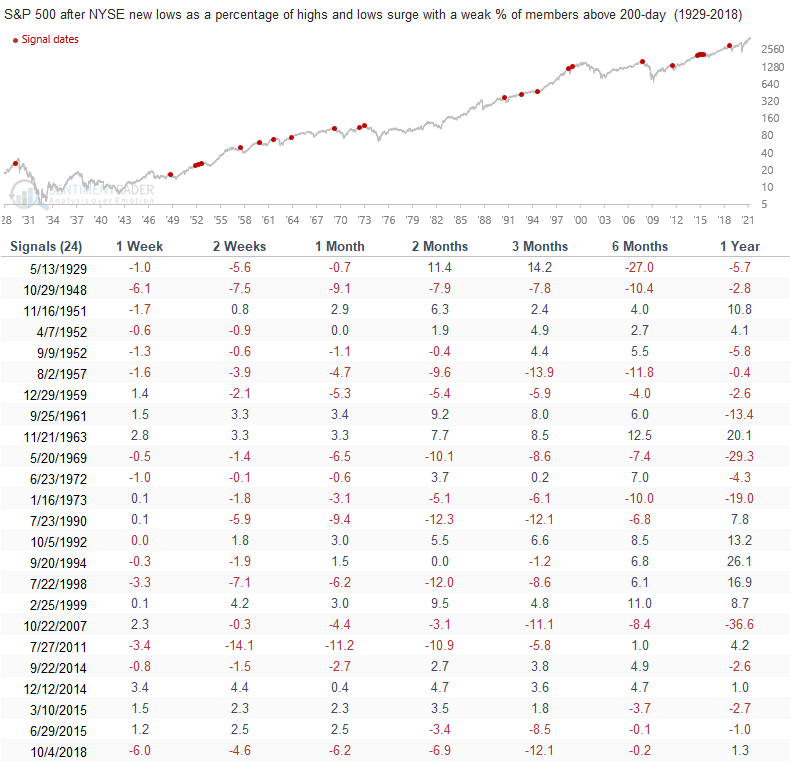
Current Day Chart
Please note, I calculate performance statistics in the chart as a short signal, whereas annualized returns result from buying the S&P 500.
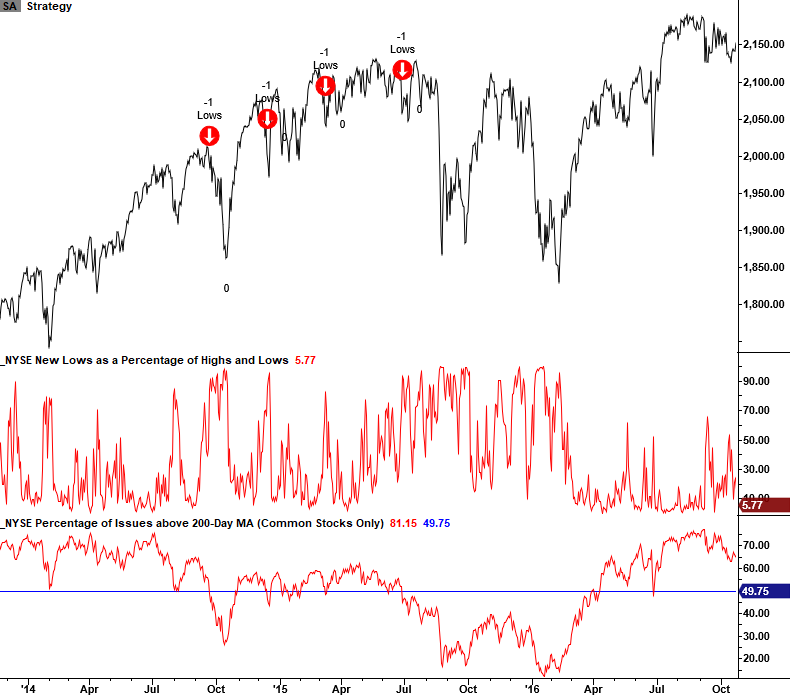
 2015-16 Oil/Commodity Bear Market
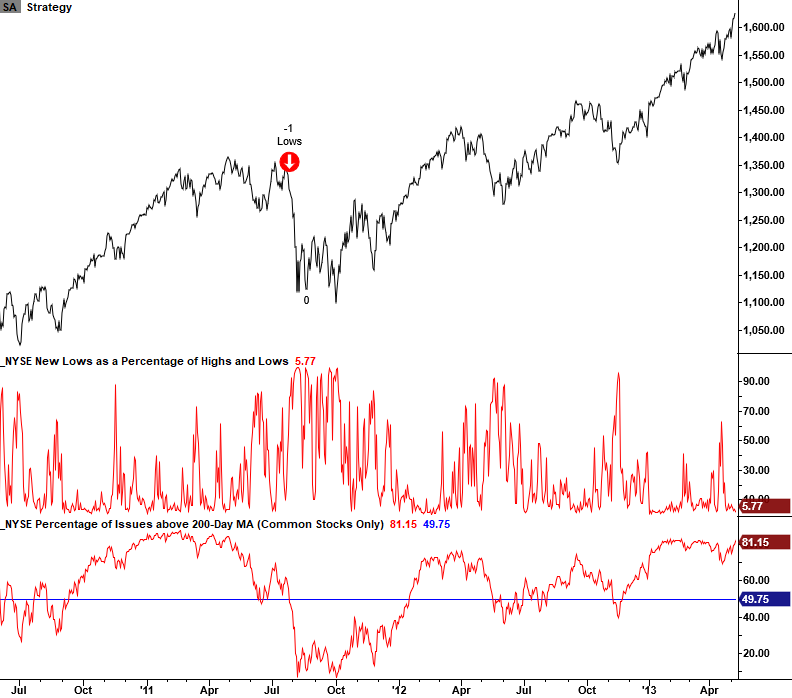
2011 Eurozone Debt Crisis
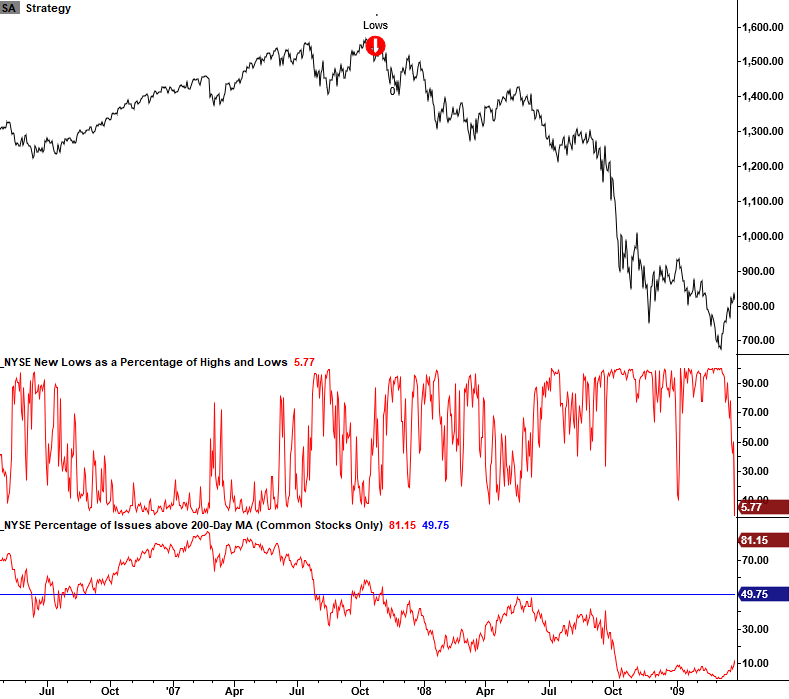
2007-08 Financial Crisis
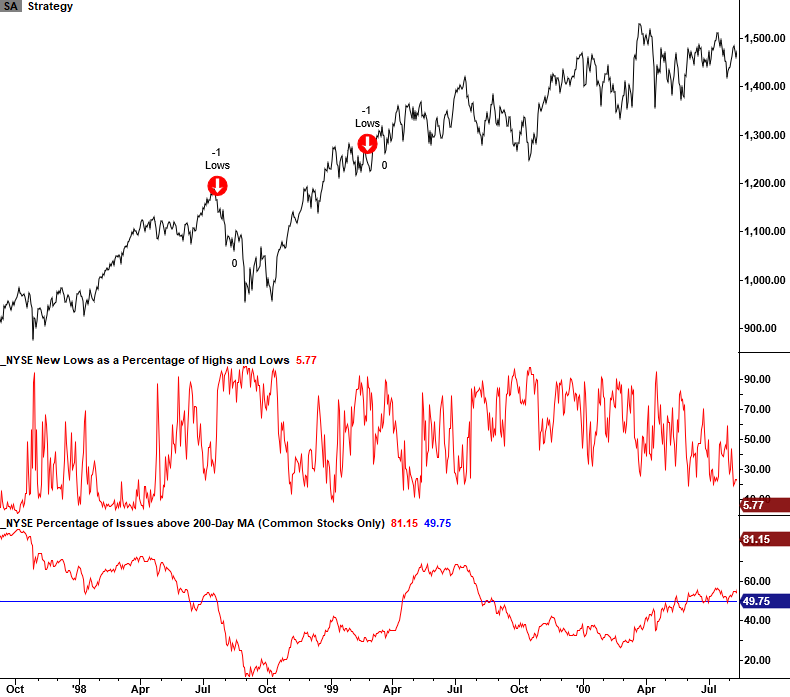
1998 LTCM
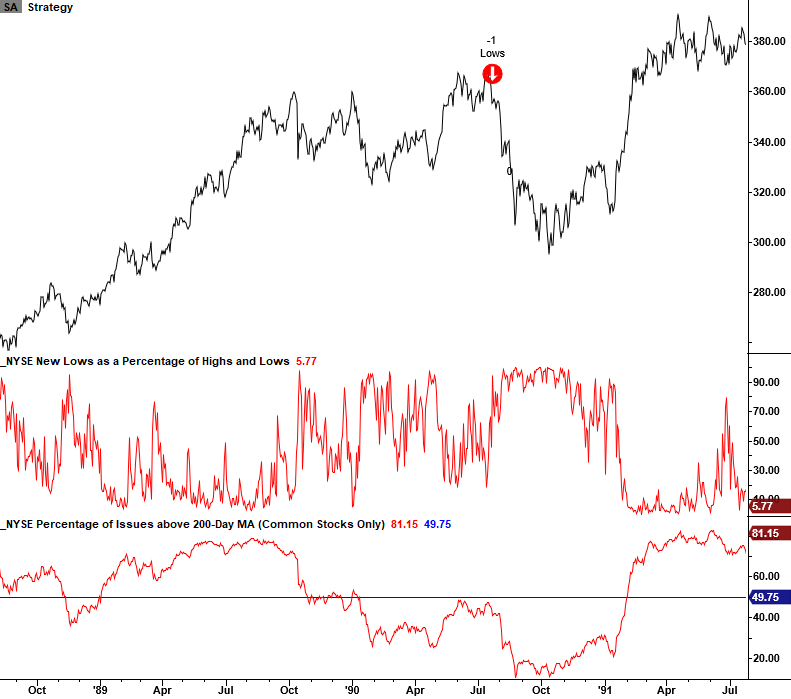
1990 Savings & Loan/Iraq Oil Spike
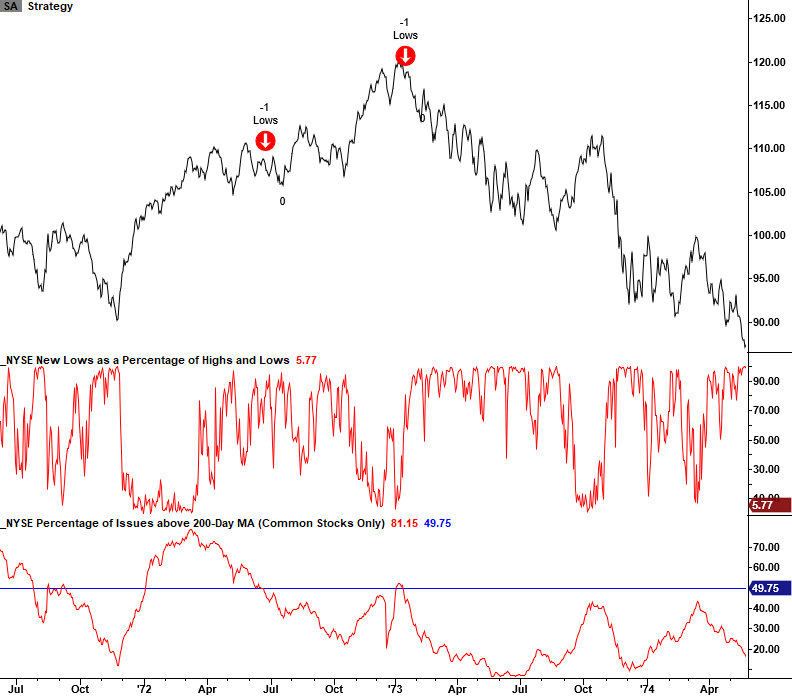
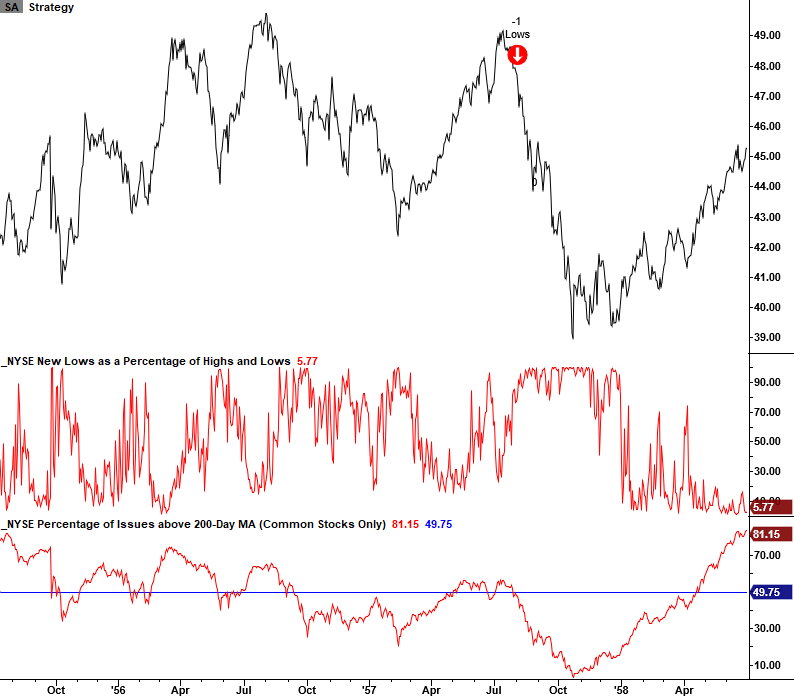
1973-74 Bretton Woods/Nixon Shock/Oil Embargo
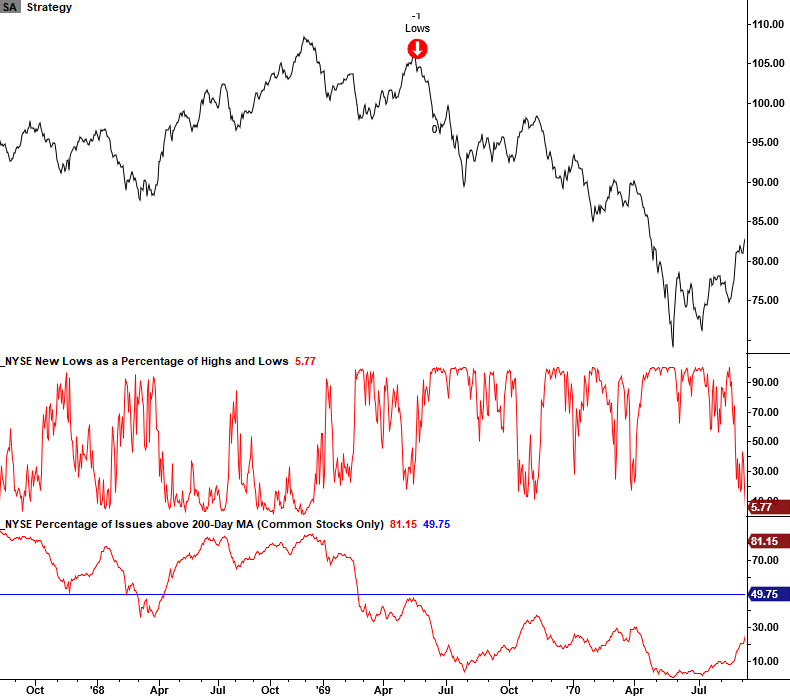
1968-70 Bear Market
1957-58 Bear Market
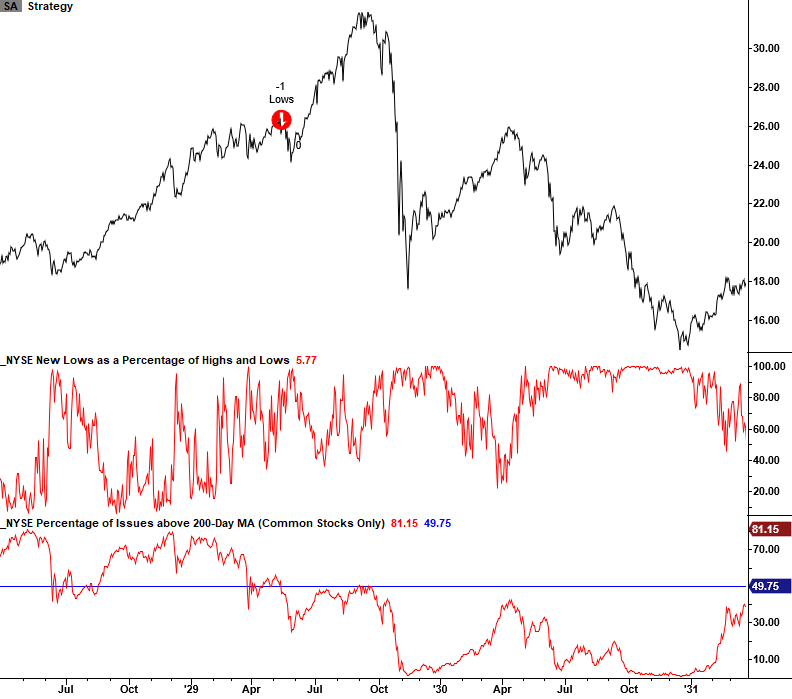
1929-32 Bear Market
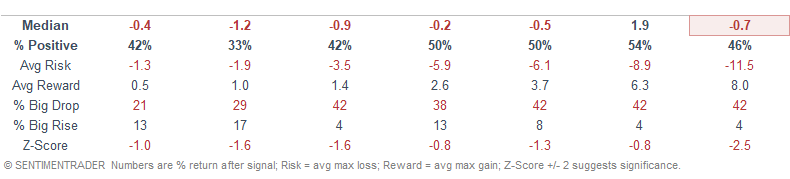
Signal Performance
Signal performance looks weak across several timeframes.
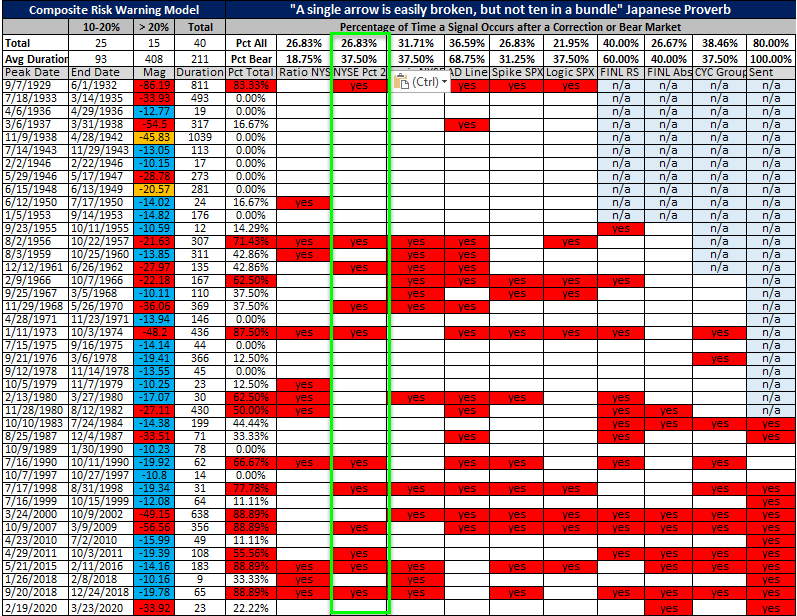
Historical TCTM Risk Warning Model Table
The following table provides a historical signal perspective for components within the TCTM Risk Warning Model. A "yes" in a model column indicates that a signal triggered either before or just after a significant correction or bear market peak.
Conclusion: NYSE new lows are minimal, and the percentage of members above the 200-day average stands at a level significantly above the warning level threshold. Therefore, I would not expect a new signal in the near term.