Products
SentimenTrader Trading Tools
‍
Backtest Engine
My Trading Toolkit
Correlation Analysis
Seasonality
Indicators & Data API
‍
Proprietary Indicators & Charts
Market Data API
Strategies & Scanner
‍
50+ Trading Strategies
Smart Stock Scanner
Research Reports
‍
Research Solutions
Reports Library
Free Resources
Simple Backtest Calculator
Simple Seasonality Calculator
The Kelly Criterion Calculator
Sentiment Geo Map
Public Research Reports
Pricing
Company
About
In the News
Testimonials
Client Success Stories
Contact
Log inLoginSign up
< BACK TO ALL REPORTS

NYSE breadth signals risk-off

Dean Christians
2021-12-02
New lows continue to outpace new highs, triggering a warning alert. Similar conditions preceded negative returns from 2-8 weeks later.

Key points:

  • NYSE new lows as a percentage of high and lows are surging
  • Long-term NYSE stock trends are weak
  • The S&P 500 is down less than 3% from its recent high
  • Similar conditions preceded negative returns from 2-4 weeks later

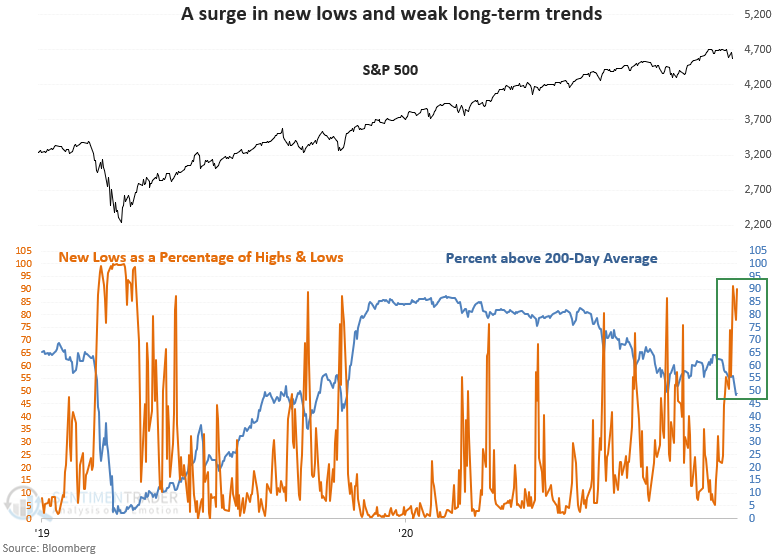
52-week lows are surging and trends are weak, triggering a new risk-off signal

A new signal from a voting member in the TCTM Risk Warning Model registered an alert on Tuesday. The component is called the 52-Week Low with Percent above 200-Day model.

The model identifies when NYSE lows as a percentage of highs and lows exceed 79% and when NYSE common stock members above their 200-day average are less than 49.75%. At the same time, the S&P 500 must be down 4.5% or less from its most recent high.

Please click here for the TCTM live updates page on the website.

The market breadth backdrop looks unhealthy

As a percentage of highs and lows, new lows have risen to the highest level since the pandemic crash. At the same time, the percentage of NYSE common stock members above their 200-day moving average has deteriorated to the lowest level in more than a year. When we compare the long-term stock trends to the price of the S&P 500, the divergence is noteworthy.

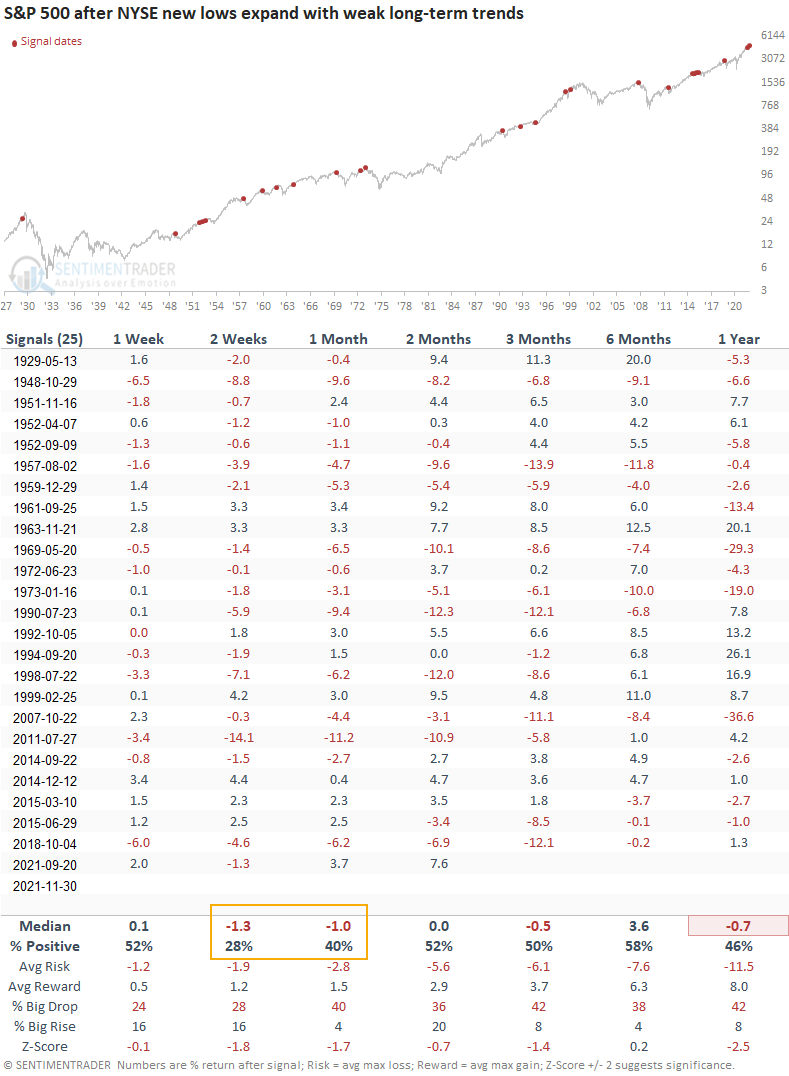
Similar signals preceded weak returns in the near term

This signal triggered 25 other times over the past 93 years. After the others, future returns and win rates were weak in the 2-4 week time frame. The 1-year results look unfavorable. However, I would note that most of the negative signals occurred before 1973.

What the research tells us...

When NYSE lows as a percentage of highs and lows are surging and long-term stock trends are weak, the market risk outweighs the reward. Similar setups to what we're seeing now have preceded weak returns and win rates in the 2-4 week time frame.

Sorry, you don't have access to this report

Upgrade your subscription plan to get access
Go to Dasboard
PRODUCTS
SentimenTrader
Trading Tools
Indicators & Data API
‍
Strategies & Scanner
‍
Research Reports
FREE
RESOUrCES
Simple Backtest
Calculator
Simple Seasonality
Calculator
The Kelly Criterion
Calculator
Sentiment Geo Map
‍
Public Research Reports
‍
Pricing
Bundle pricing
‍
Announcements
‍
FAQ
COMPANY
‍
About
‍
In the News
‍
Testimonials
‍
Client Success Stories
CONTACT
‍
General Inquiries
‍
Media Inquiries
‍
Financial Professionals Inquiries
‍
© 2025 Sundial Capital Research Inc. All rights reserved.
Setsail Marketing
TermsPrivacyAffiliate Program
Risk Disclosure: Futures and forex trading contains substantial risk and is not for every investor. An investor could potentially lose all or more than the initial investment. Risk capital is money that can be lost without jeopardizing ones’ financial security or life style. Only risk capital should be used for trading and only those with sufficient risk capital should consider trading. Past performance is not necessarily indicative of future results.

Hypothetical Performance Disclosure: Hypothetical performance results have many inherent limitations, some of which are described below. No representation is being made that any account will or is likely to achieve profits or losses similar to those shown; in fact, there are frequently sharp differences between hypothetical performance results and the actual results subsequently achieved by any particular trading program. One of the limitations of hypothetical performance results is that they are generally prepared with the benefit of hindsight. In addition, hypothetical trading does not involve financial risk, and no hypothetical trading record can completely account for the impact of financial risk of actual trading. for example, the ability to withstand losses or to adhere to a particular trading program in spite of trading losses are material points which can also adversely affect actual trading results. There are numerous other factors related to the markets in general or to the implementation of any specific trading program which cannot be fully accounted for in the preparation of hypothetical performance results and all which can adversely affect trading results.

Testimonial Disclosure: Testimonials appearing on this website may not be representative of other clients or customers and is not a guarantee of future performance or success.