Data &
Technology
Research
Reports
Report Solutions
Reports Library
Actionable
Strategies
Free
Resources
Simple Backtest Calculator
Simple Seasonality Calculator
The Kelly Criterion Calculator
Sentiment Geo Map
Public Research Reports
Free Webinar
Pricing
Company
About
Meet Our Team
In the News
Testimonials
Client Success Stories
Contact
Log inLoginSign up
< BACK TO ALL REPORTS

Not a single source of pessimism

Jason Goepfert
2021-02-17
More than half of our core indicators are showing excessive optimism, and not a single one is showing pessimism.

Options speculation is spiking yet again, volume in the most leveraged parts of the market has never been greater, and signs of euphoria are everywhere.

With so many indicators showing optimism, there are usually a couple of odd exceptions that suggest pessimism. It's rare for everything to agree at the same time. This is one of those rare times, though, with more than 50% of our core indicators showing an optimistic extreme and exactly 0% showing a pessimistic one.

Percentage of optimistic versus pessimistic indicators

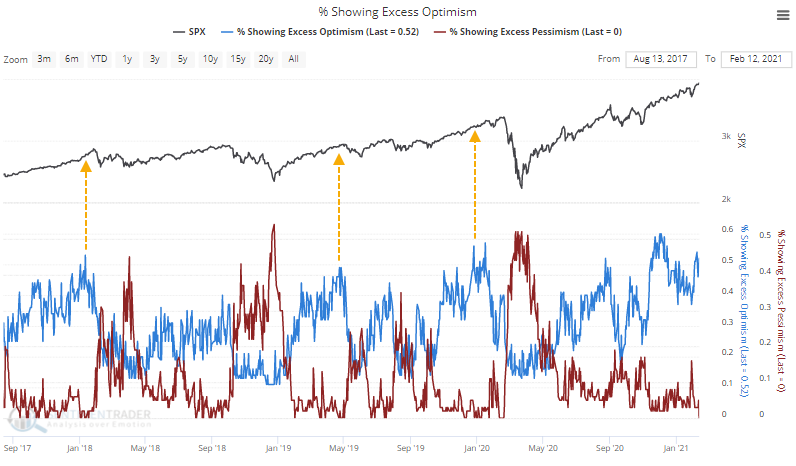
This kind of lopsided skew among indicators has preceded some tough markets.

The Risk/Reward Table, which shows the biggest losses and largest gains at any point across the various time frames, shows limited upside relative to the downside, with 2017 really being the lone exception.


What else we're looking at

  • An objective look at net speculation relative to overall volume among options traders
  • What the put/call ratio looked like in the 1990s
  • The Panic / Euphoria Model has never shown more "euphoria"
  • Full returns following an extreme of extremes
  • What happens when Dumb Money Confidence has been right for so long
  • An in-depth update to the Tactical Composite Trend Model and what it's telling us now
  • A primer on what you're getting into with options trading
  • What happens to gold and miners after a long streak with the 50-day average above the 200-day
  • Forward returns after a plunge like TLT has just suffered

Stat Box

For the first time in 544 days, the 50-day moving average on gold fell below the 200-day average, ending a Golden Cross and moving into a Death Cross. That ends the 5th-longest streak since 1975.


Sentiment from other perspectives

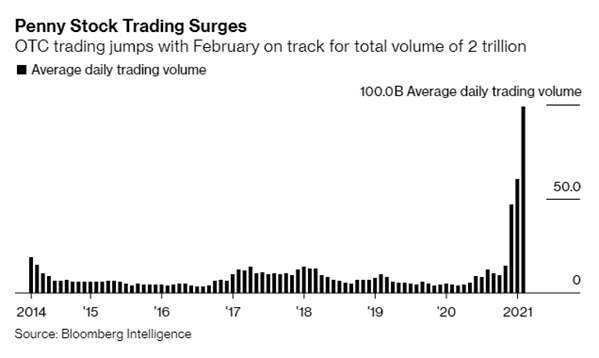
Keep pumpin' those pink sheets. This shouldn't be a surprise to anyone here, but trading activity in the most speculative parts of the market continues to skyrocket, with penny stock volume now on track for 2 trillion shares. Source: Bloomberg

penny stock volume

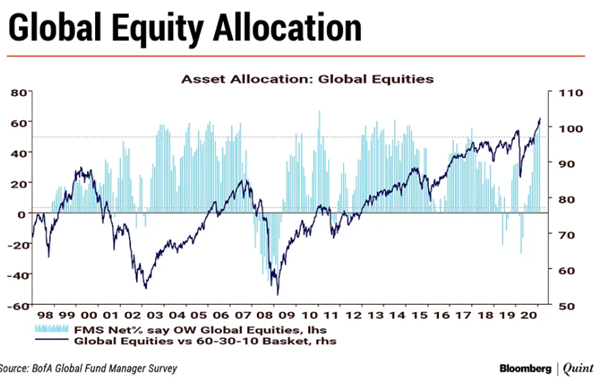
Everyone in. Some of the biggest fund managers in the world are nearing all-in on equities. They are more than 60% overweight global stocks for only the 2nd time in over 20 years. Source: BofA via Bloomberg

bofa fund manager survey global manager overweight equities

No comment needed. This says everything about where we are in the cycle. Source: Crystal Tse

DATA &
TECHnologies
IndicatorEdge
‍
BackTestEdge
‍
Other Tools
‍
DataEdge API
RESEARCH
reports
Research Solution
‍
Reports Library
‍
actionable
Strategies
Trading Strategies
‍
Smart Stock Scanner
‍
FREE
RESOUrCES
Simple Backtest
Calculator
Simple Seasonality
Calculator
The Kelly Criterion
Calculator
Sentiment Geo Map
‍
Public Research Reports
‍
Free Webinar
COMPANY
‍
About
‍
Meet our Team
‍
In the News
‍
Testimonials
‍
Client Success Stories
Pricing
Bundle pricing
‍
Announcements
‍
FAQ
© 2024 Sundial Capital Research Inc. All rights reserved.
Setsail Marketing
TermsPrivacyAffiliate Program
Risk Disclosure: Futures and forex trading contains substantial risk and is not for every investor. An investor could potentially lose all or more than the initial investment. Risk capital is money that can be lost without jeopardizing ones’ financial security or life style. Only risk capital should be used for trading and only those with sufficient risk capital should consider trading. Past performance is not necessarily indicative of future results.

Hypothetical Performance Disclosure: Hypothetical performance results have many inherent limitations, some of which are described below. No representation is being made that any account will or is likely to achieve profits or losses similar to those shown; in fact, there are frequently sharp differences between hypothetical performance results and the actual results subsequently achieved by any particular trading program. One of the limitations of hypothetical performance results is that they are generally prepared with the benefit of hindsight. In addition, hypothetical trading does not involve financial risk, and no hypothetical trading record can completely account for the impact of financial risk of actual trading. for example, the ability to withstand losses or to adhere to a particular trading program in spite of trading losses are material points which can also adversely affect actual trading results. There are numerous other factors related to the markets in general or to the implementation of any specific trading program which cannot be fully accounted for in the preparation of hypothetical performance results and all which can adversely affect trading results.

Testimonial Disclosure: Testimonials appearing on this website may not be representative of other clients or customers and is not a guarantee of future performance or success.