
Non-Confirmation From Cyclical Groups

The S&P 500 has now recorded ten new 252-day highs in the last month as a basket of cyclical groups has failed to record a single new high. That's never happened in the 60+ year history of the data, not even during the height of the internet bubble.
Let's take a look at some charts and a signal I designed with the data.
CYCLICAL COMPONENTS
- Automobiles & Auto Components Industry Group
- Transports Industry Group
- Homebuilding Sub-Industry
- Consumer Discretionary Sector Equal-Weight
- Financials Sector Equal-Weight
- Industrials Sector Equal-Weight
- Small Cap Index
If the cyclical group components look familiar, that's because I use the same ones for a risk-off algorithm in the TCTM Risk Warning Model. Please click here for a note on the model.
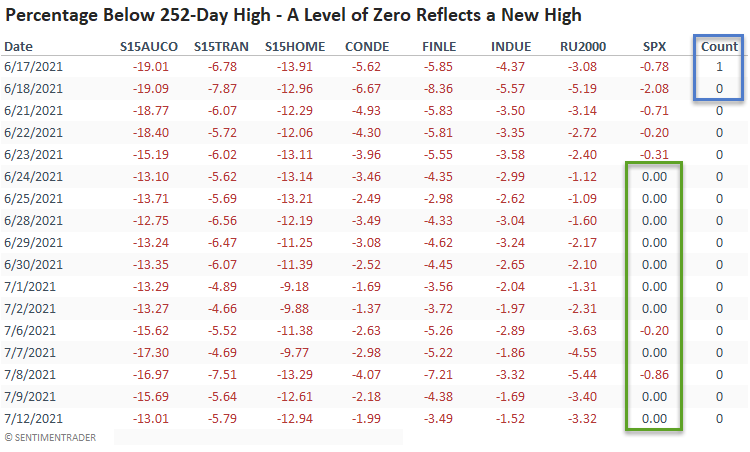
NON-CONFIRMATION TABLE
As the table shows, the S&P 500 has recorded ten new 252-day highs as the new high count for the cyclical groups has remained at zero since 6/18/21. The last high for any cyclical group occurred on 6/4/21. In case you were wondering which group, it was financials.
HISTORICAL CHART
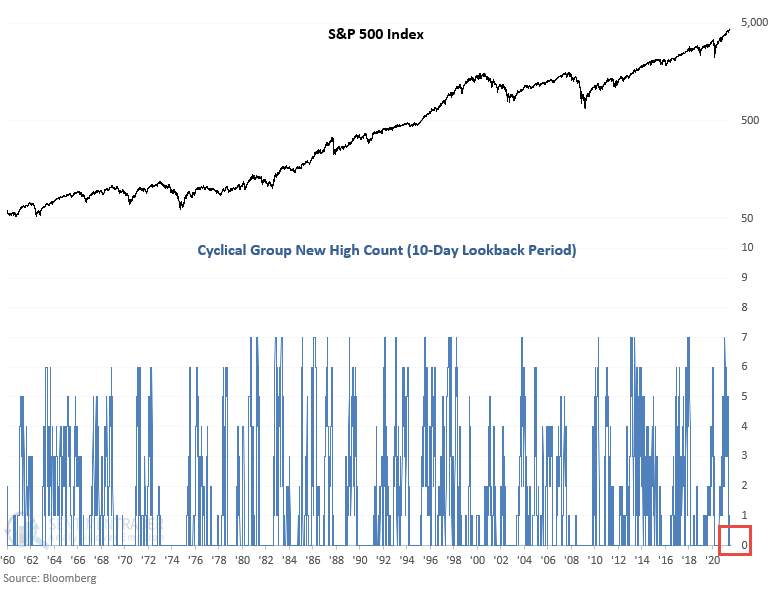
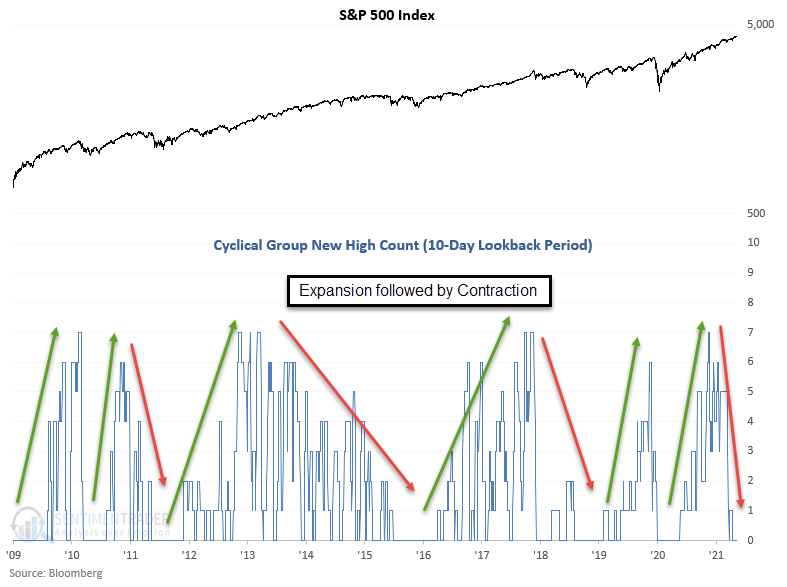
CHART SINCE 2009 LOW
In a healthy uptrend, we should see the count sustain itself above a level of two. On occasion, it will drop to zero in an uptrend. When it does, it typically resolves itself one way or the other in short order. i.e., the cyclical groups catch up by recording new highs or the market corrects.
 HISTORICAL COUNT
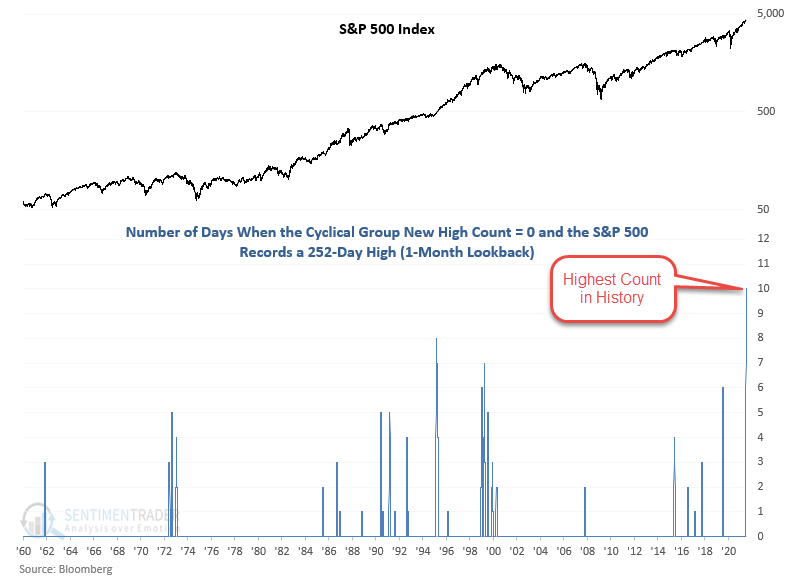
The following chart provides some perspective on the current lack of new highs from the cyclical groups. The indicator counts the number of days when the cyclical count is zero, and the S&P 500 records a 252-day high. The lookback count uses a rolling 21-day period.
Let's review a risk-off signal I created with the data.
MODEL CONCEPT
The cyclical group new high count model identifies when economically sensitive groups are failing to confirm new highs in the broad market as measured by the S&P 500. The model will issue an alert based upon the following conditions.
SIGNAL CRITERIA
- If the cyclical group new high count = 0
- If the S&P 500 records a 252-day high
- If Condition 1 and 2, start days since true count.
- If days since true count <= 5 and the 5-day rate of change for the S&P 500 < 0, then signal risk-off.
- If the cyclical group new high count crosses above the reset threshold then Firtscross = true. i.e. a reset to screen out duplicate signals
HOW THE SIGNALS PERFORMED
While the sample size is small, the results are weak across almost all timeframes.
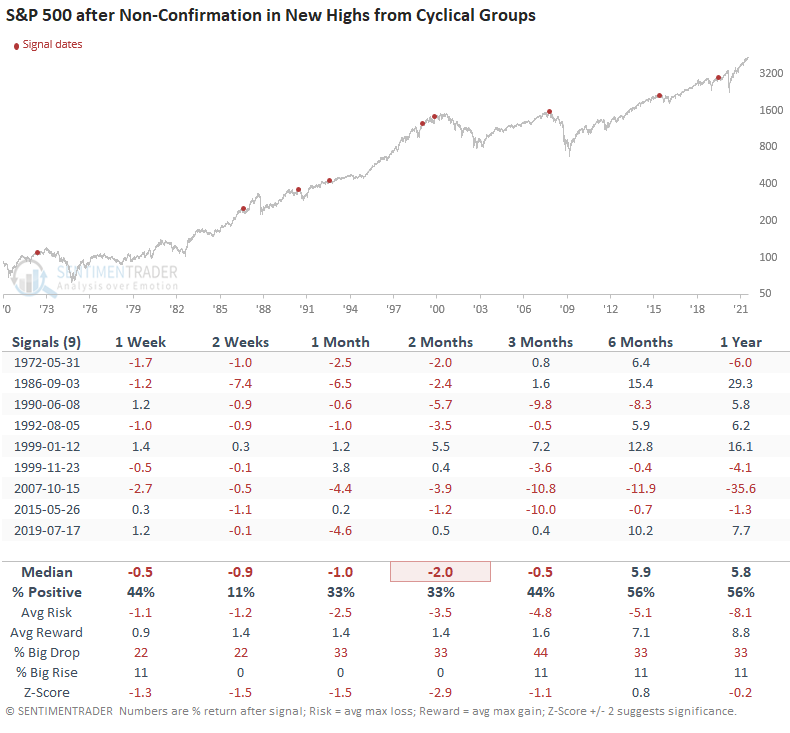
The following is a critical point regarding this model and others that I have shared with subscribers. I always put a momentum condition in risk-off signals. The cyclical group new high count model provides a perfect example of why it is essential. The model would have triggered an alert on 6/24/21 without the rate of change condition, a level that is over 100 points lower.
One additional point I want to make in today's note has to do with indicator diversification. When I construct composite models, I always use components with different input lengths, i.e., one indicator may use a 10-day calculation. In contrast, another piece uses a 50-day calculation. My risk warning model uses more medium to long-duration measures and hence why we have not seen an alert.
For now, the TCTM continues with a bullish status. Therefore, I must remain invested despite some alarming short-term breadth conditions.