Products
SentimenTrader Trading Tools
‍
Backtest Engine
My Trading Toolkit
Correlation Analysis
Seasonality
Market Prediction
Indicators & Data API
‍
Proprietary Indicators & Charts
Market Data API
Strategies & Scanner
‍
50+ Trading Strategies
Smart Stock Scanner
Smart Option Scanner
Research Reports
‍
Research Solutions
Reports Library
Free Resources
Simple Backtest Calculator
Simple Seasonality Calculator
The Kelly Criterion Calculator
Sentiment Geo Map
Public Research Reports
Education
Sentiment Indicators
Technical Indicators
Pricing
Company
About
In the News
Testimonials
Client Success Stories
Contact
Log inLoginSign up
< BACK TO ALL REPORTS

No yen to buy the yen

Jay Kaeppel
2022-01-06
One of the most important - and oft-overlooked - trading decisions is simply whether to trade a given market or stock or to stand aside. As a case in point, let's consider the plight of the Japanese Yen.

Key Points

  • The Japanese Yen tends to be very indecisive during the first quarter, which can make it very difficult to trade
  • Non-futures traders can trade the Yen using shares of the Invesco CurrencyShares Japanese Yen Trust ETF (FXY)
  • Trader sentiment is throwing something of a curveball at the moment
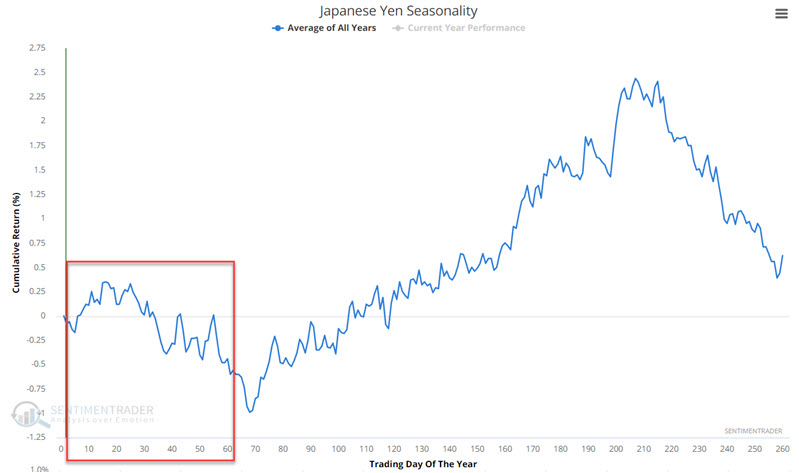
Yen Seasonality

The chart below displays the Annual Seasonal Trend for the Japanese Yen. As you can see, the action in the first quarter of the year tends to be choppy and entirely lacking in trend. This creates a challenging trading environment for bulls and bears.

The chart below displays the $ +(-) achieved by holding a long position in the Japanese Yen during each year's first 67 trading days since 1971.

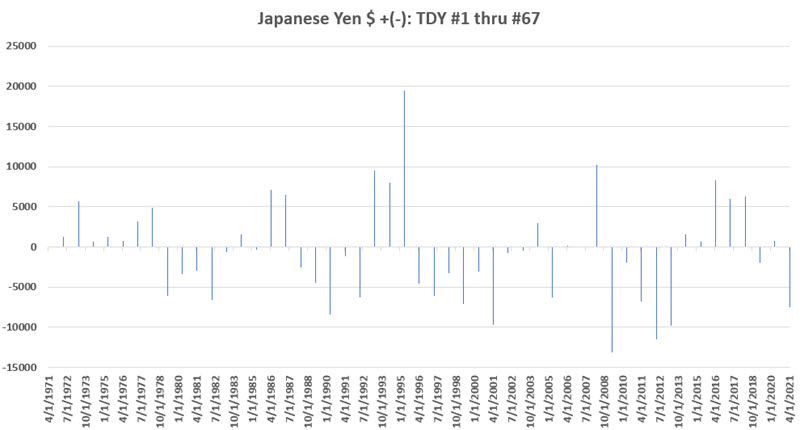
The chart below displays the cumulative $ +(-) achieved by holding a long position in Japanese Yen futures during every year's first 67 trading days since 1971. 

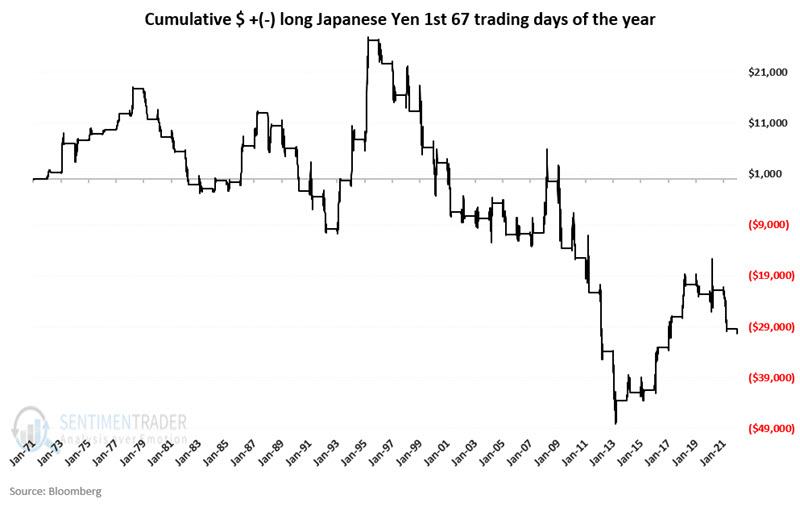
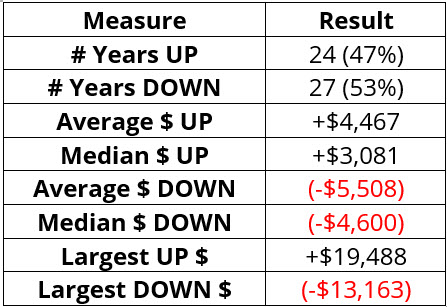
We see in the charts above a decided lack of a long-term "edge" one way or the other. This "gut" observation is born out by the performance results displayed in the table below. As you can see, there are no discernible tendencies to hang one's hat on.

Yen Optix

For most markets, a persistently low level of Optix tends to be bullish for that market. The Yen is an exception to the rule. The chart below displays those instances when the 50-day average for Yen Optix crossed above 27.

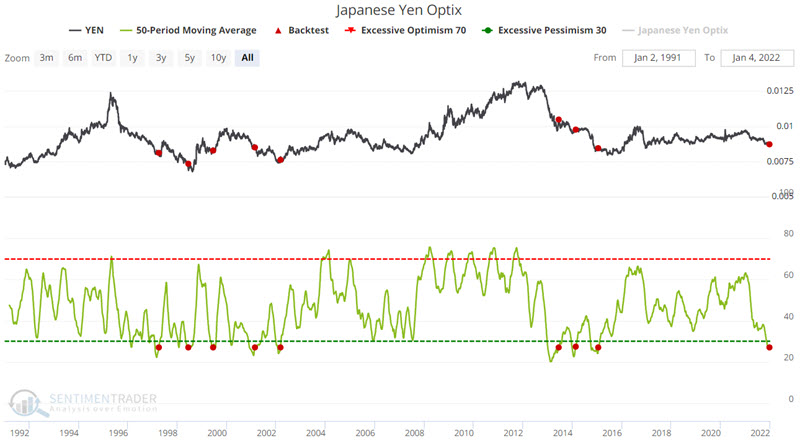
The table below displays the performance results for the Yen following previous instances. Typically, we would expect to see positive results following a low-level reversal. But as I mentioned, the Yen is an exception to this rule. 

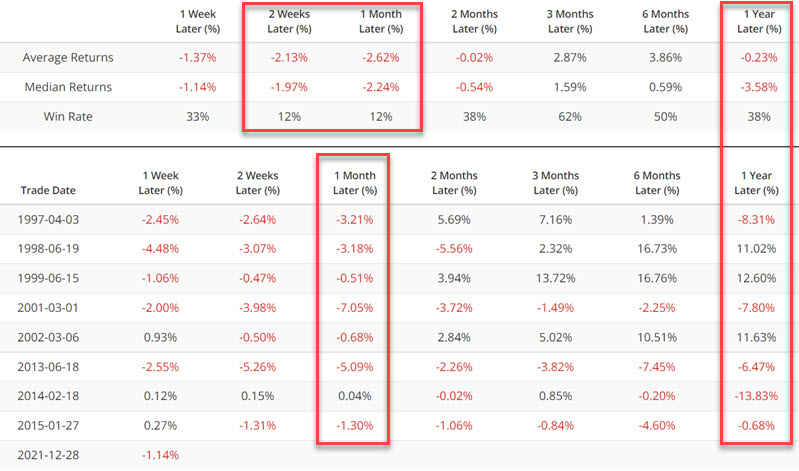
The 2-week and 1-month returns for the Yen following previous signals have been decidedly unfavorable. Even 12-month returns have overall been negative.

An alternative to Japanese Yen futures

The chart below displays a long-term chart for the Invesco CurrencyShares Japanese Yen Trust ETF (FXY).

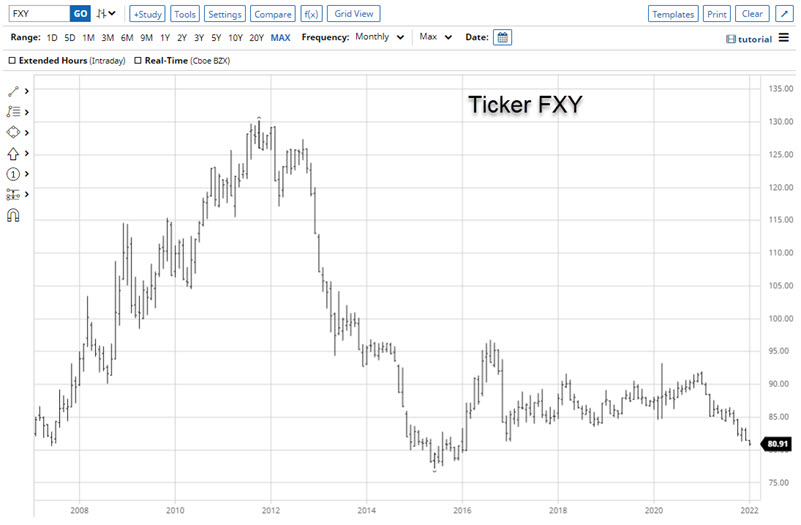
A non-futures trader can trade the Japanese Yen using shares of FXY just as they would buy and sell stock. As you can see, FXY has recently plunged to a 5-year low.

What the research tells us...

Different traders look at different factors. Some traders will look at the chart above, see a market in the throes of a significant long-term decline, and consider trading the short side. Others will look at the same chart, see a market overdue for a substantial bounce, and consider trading the long side. From our perspective, the long-term downtrend combined with the history of the Optix signals highlighted above suggests continuing to focus on the short side. However, the highly unpredictable nature of historical Yen performance during the 1st quarter suggests that this may well be a market worth steering clear of for the time being.

PRODUCTS
SentimenTrader
Trading Tools
Indicators & Data API
‍
Strategies & Scanner
‍
Research Reports
FREE
RESOUrCES
Simple Backtest
Calculator
Simple Seasonality
Calculator
The Kelly Criterion
Calculator
Sentiment Geo Map
‍
Public Research Reports
‍
Education
Sentiment Indicators
‍
Technical Indicators
‍
Pricing
Bundle pricing
‍
FAQ
‍
Announcements
‍
COMPANY
‍
About
‍
In the News
‍
Testimonials
‍
Client Success Stories
CONTACT
‍
General Inquiries
‍
Media Inquiries
‍
Financial Professionals Inquiries
‍
© 2026 Sundial Capital Research Inc. All rights reserved.
Setsail Marketing
TermsPrivacyAffiliate Program
Risk Disclosure: The information and tools provided are for research and analytical purposes only and are not intended as investment advice. Market analysis involves uncertainty, and outcomes may differ from expectations. Users should conduct their own due diligence and consider their individual circumstances before making any financial decisions. Past performance is not necessarily indicative of future results.

Hypothetical Performance Disclosure: Hypothetical performance results have many inherent limitations, some of which are described below. No representation is being made that any account will or is likely to achieve profits or losses similar to those shown; in fact, there are frequently sharp differences between hypothetical performance results and the actual results subsequently achieved by any particular trading program. One of the limitations of hypothetical performance results is that they are generally prepared with the benefit of hindsight. In addition, hypothetical trading does not involve financial risk, and no hypothetical trading record can completely account for the impact of financial risk of actual trading. for example, the ability to withstand losses or to adhere to a particular trading program in spite of trading losses are material points which can also adversely affect actual trading results. There are numerous other factors related to the markets in general or to the implementation of any specific trading program which cannot be fully accounted for in the preparation of hypothetical performance results and all which can adversely affect trading results.

Testimonial Disclosure: Testimonials appearing on this website may not be representative of other clients or customers and is not a guarantee of future performance or success.