
No stress in bond land

Key points:
- Credit default swaps show that bond traders are not anxious about widespread defaults
- Stocks had a strong tailwind when the CDX Index was below its 50-day average
- Its extended time below average has not suggested that the trends are unsustainable
It's A-OK in bond land
One of the cornerstones of a healthy stock market environment is a lack of bond market anxiety. Whether the bond market is "smarter" is up for debate; it's not something we've ever been able to prove with consistency.
A good proxy for bond market anxiety is bond traders' pricing of credit default swaps. As long as traders are not paying up for protection against bond defaults, especially if they're not rapidly re-pricing that risk, things are usually okay in the stock market.
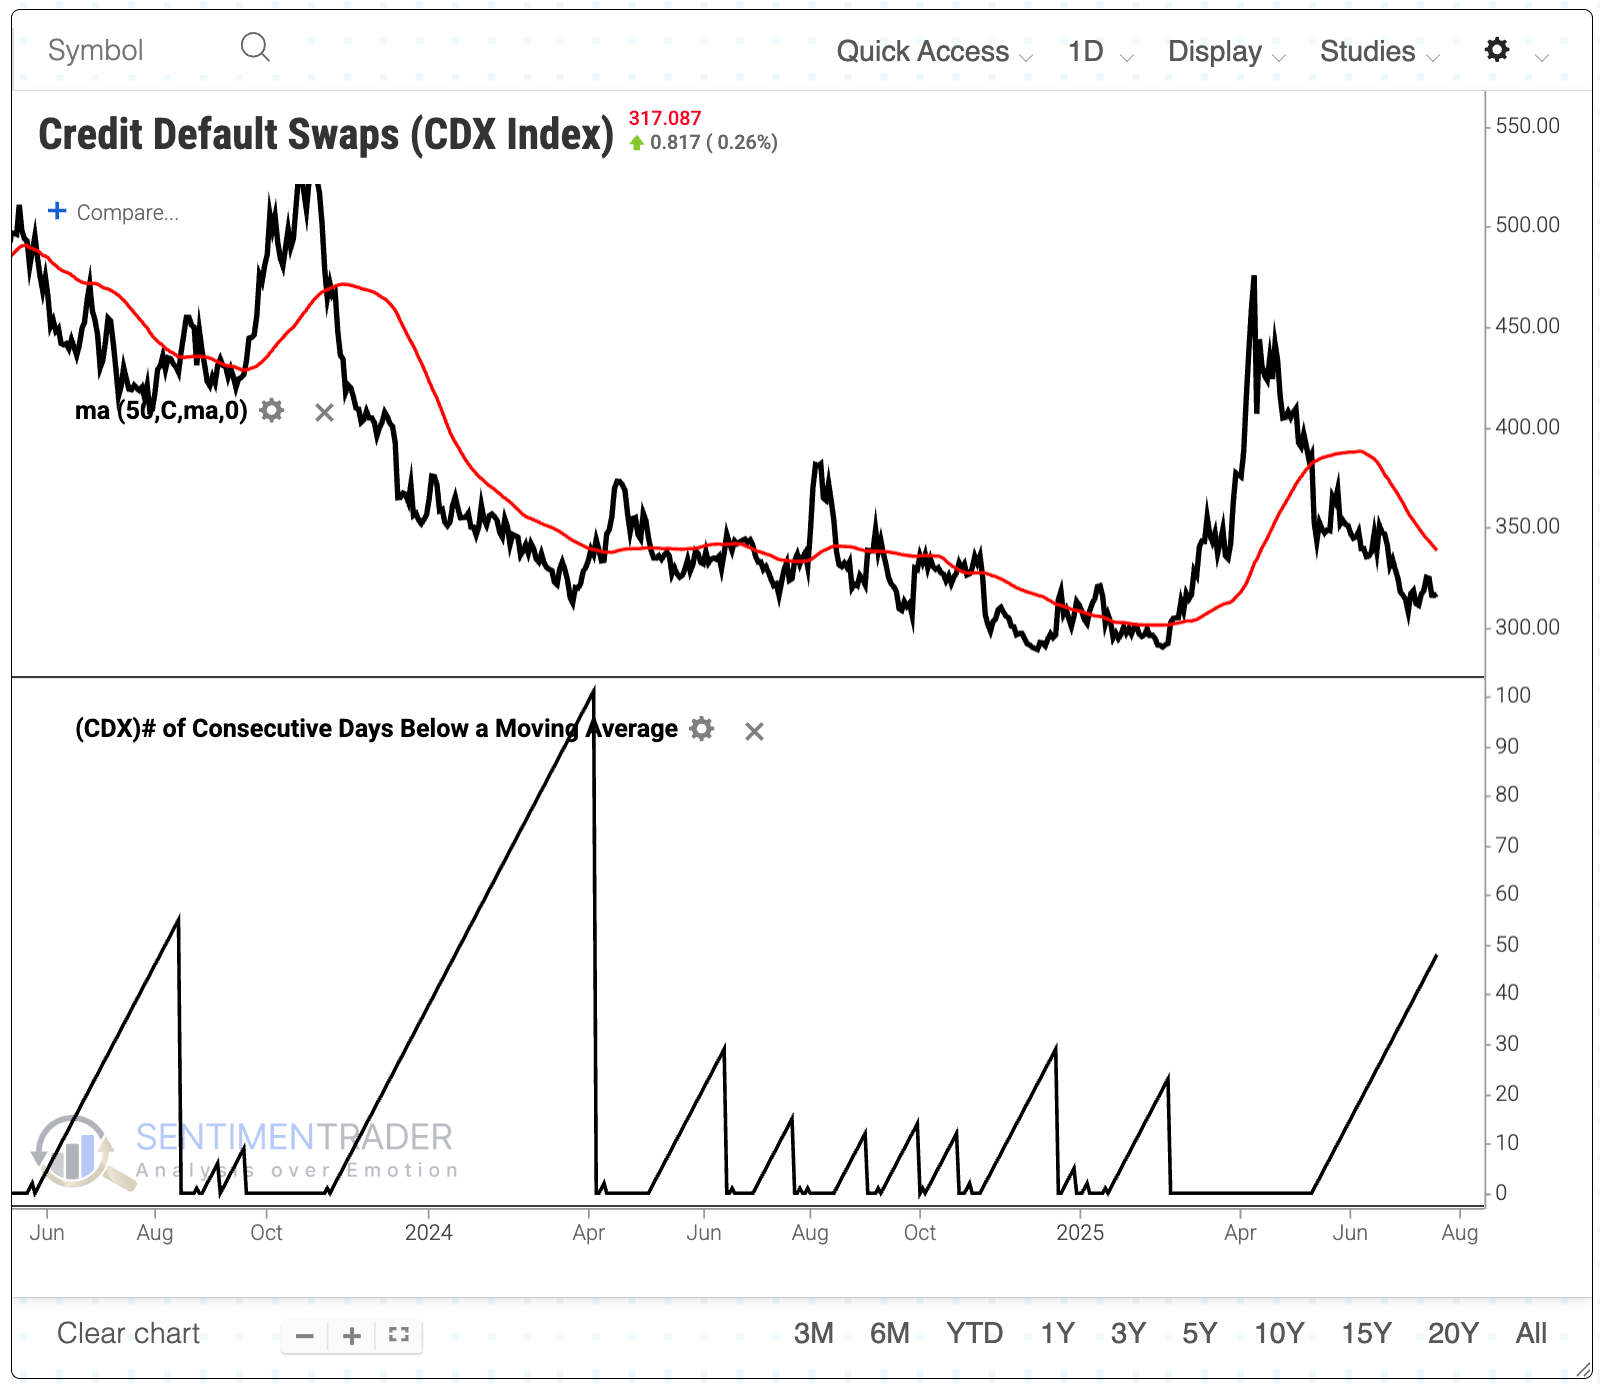
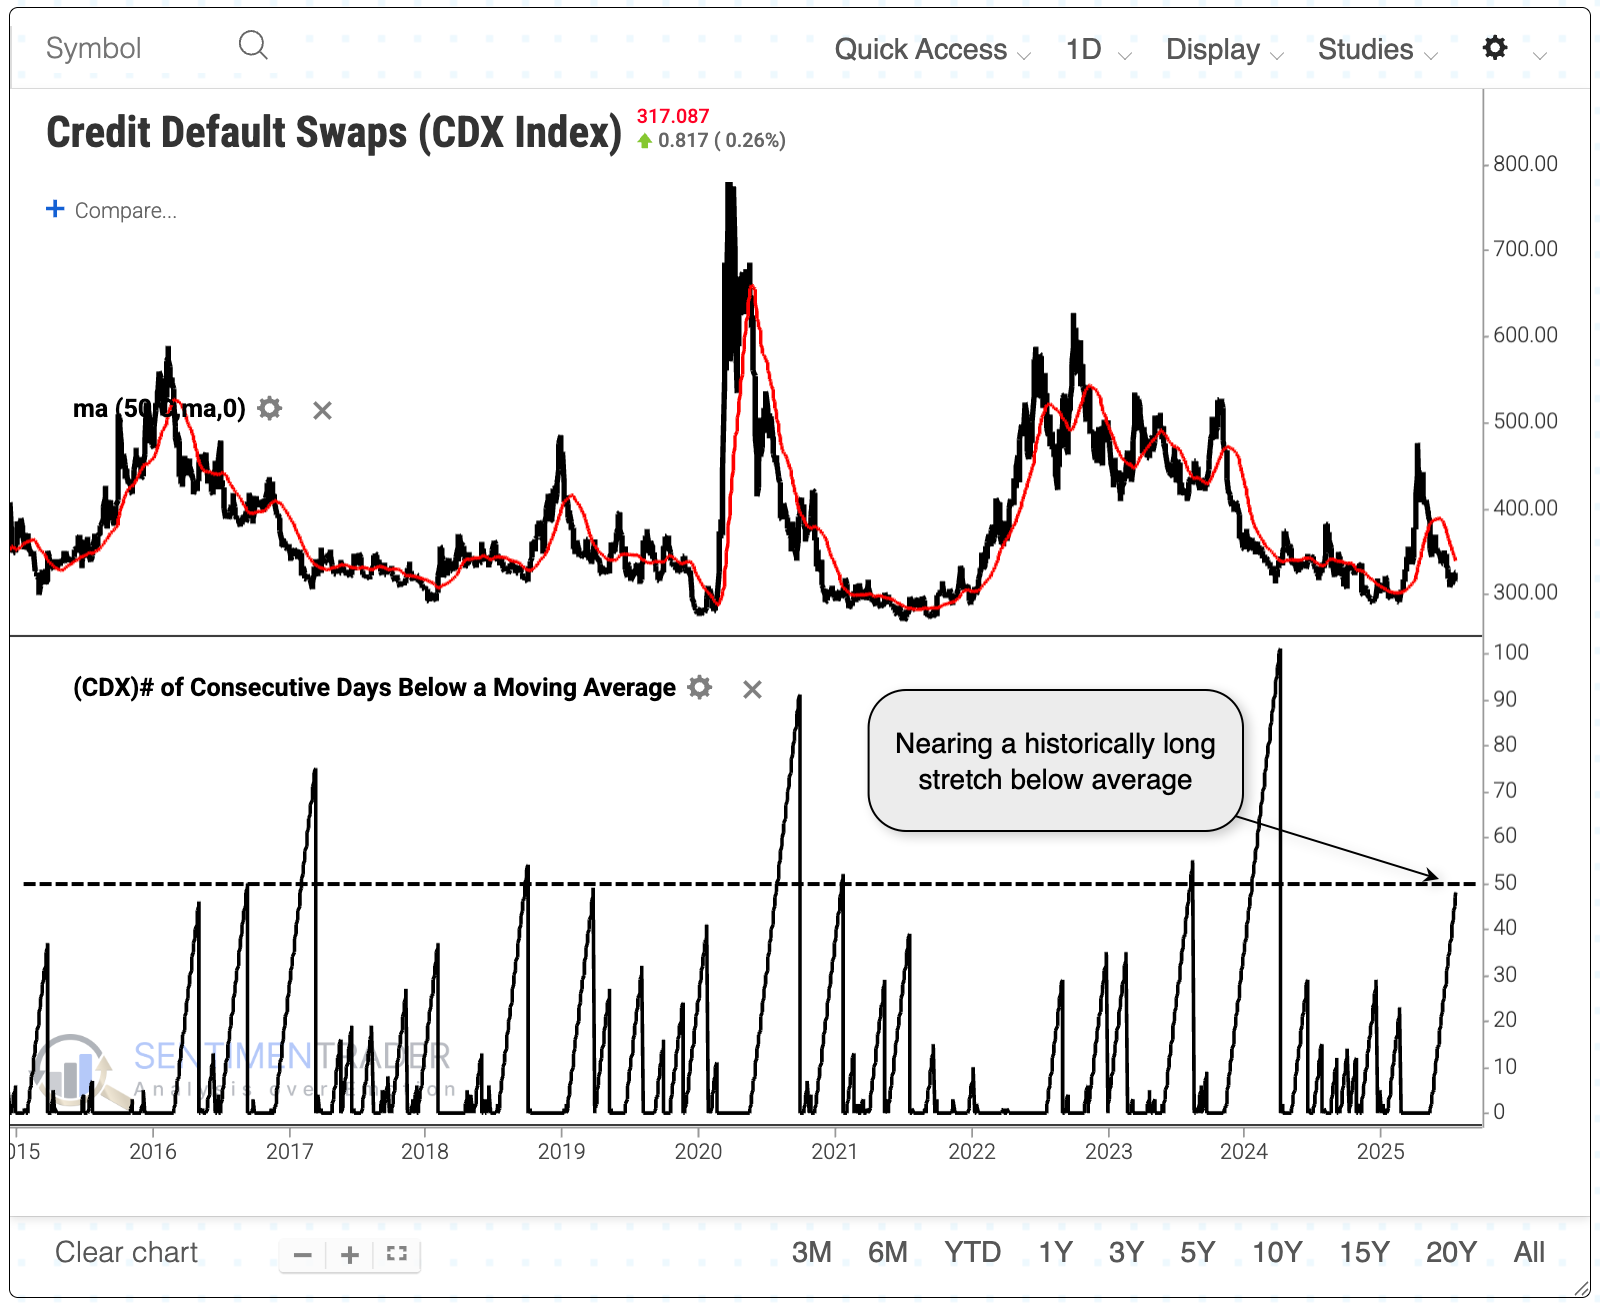
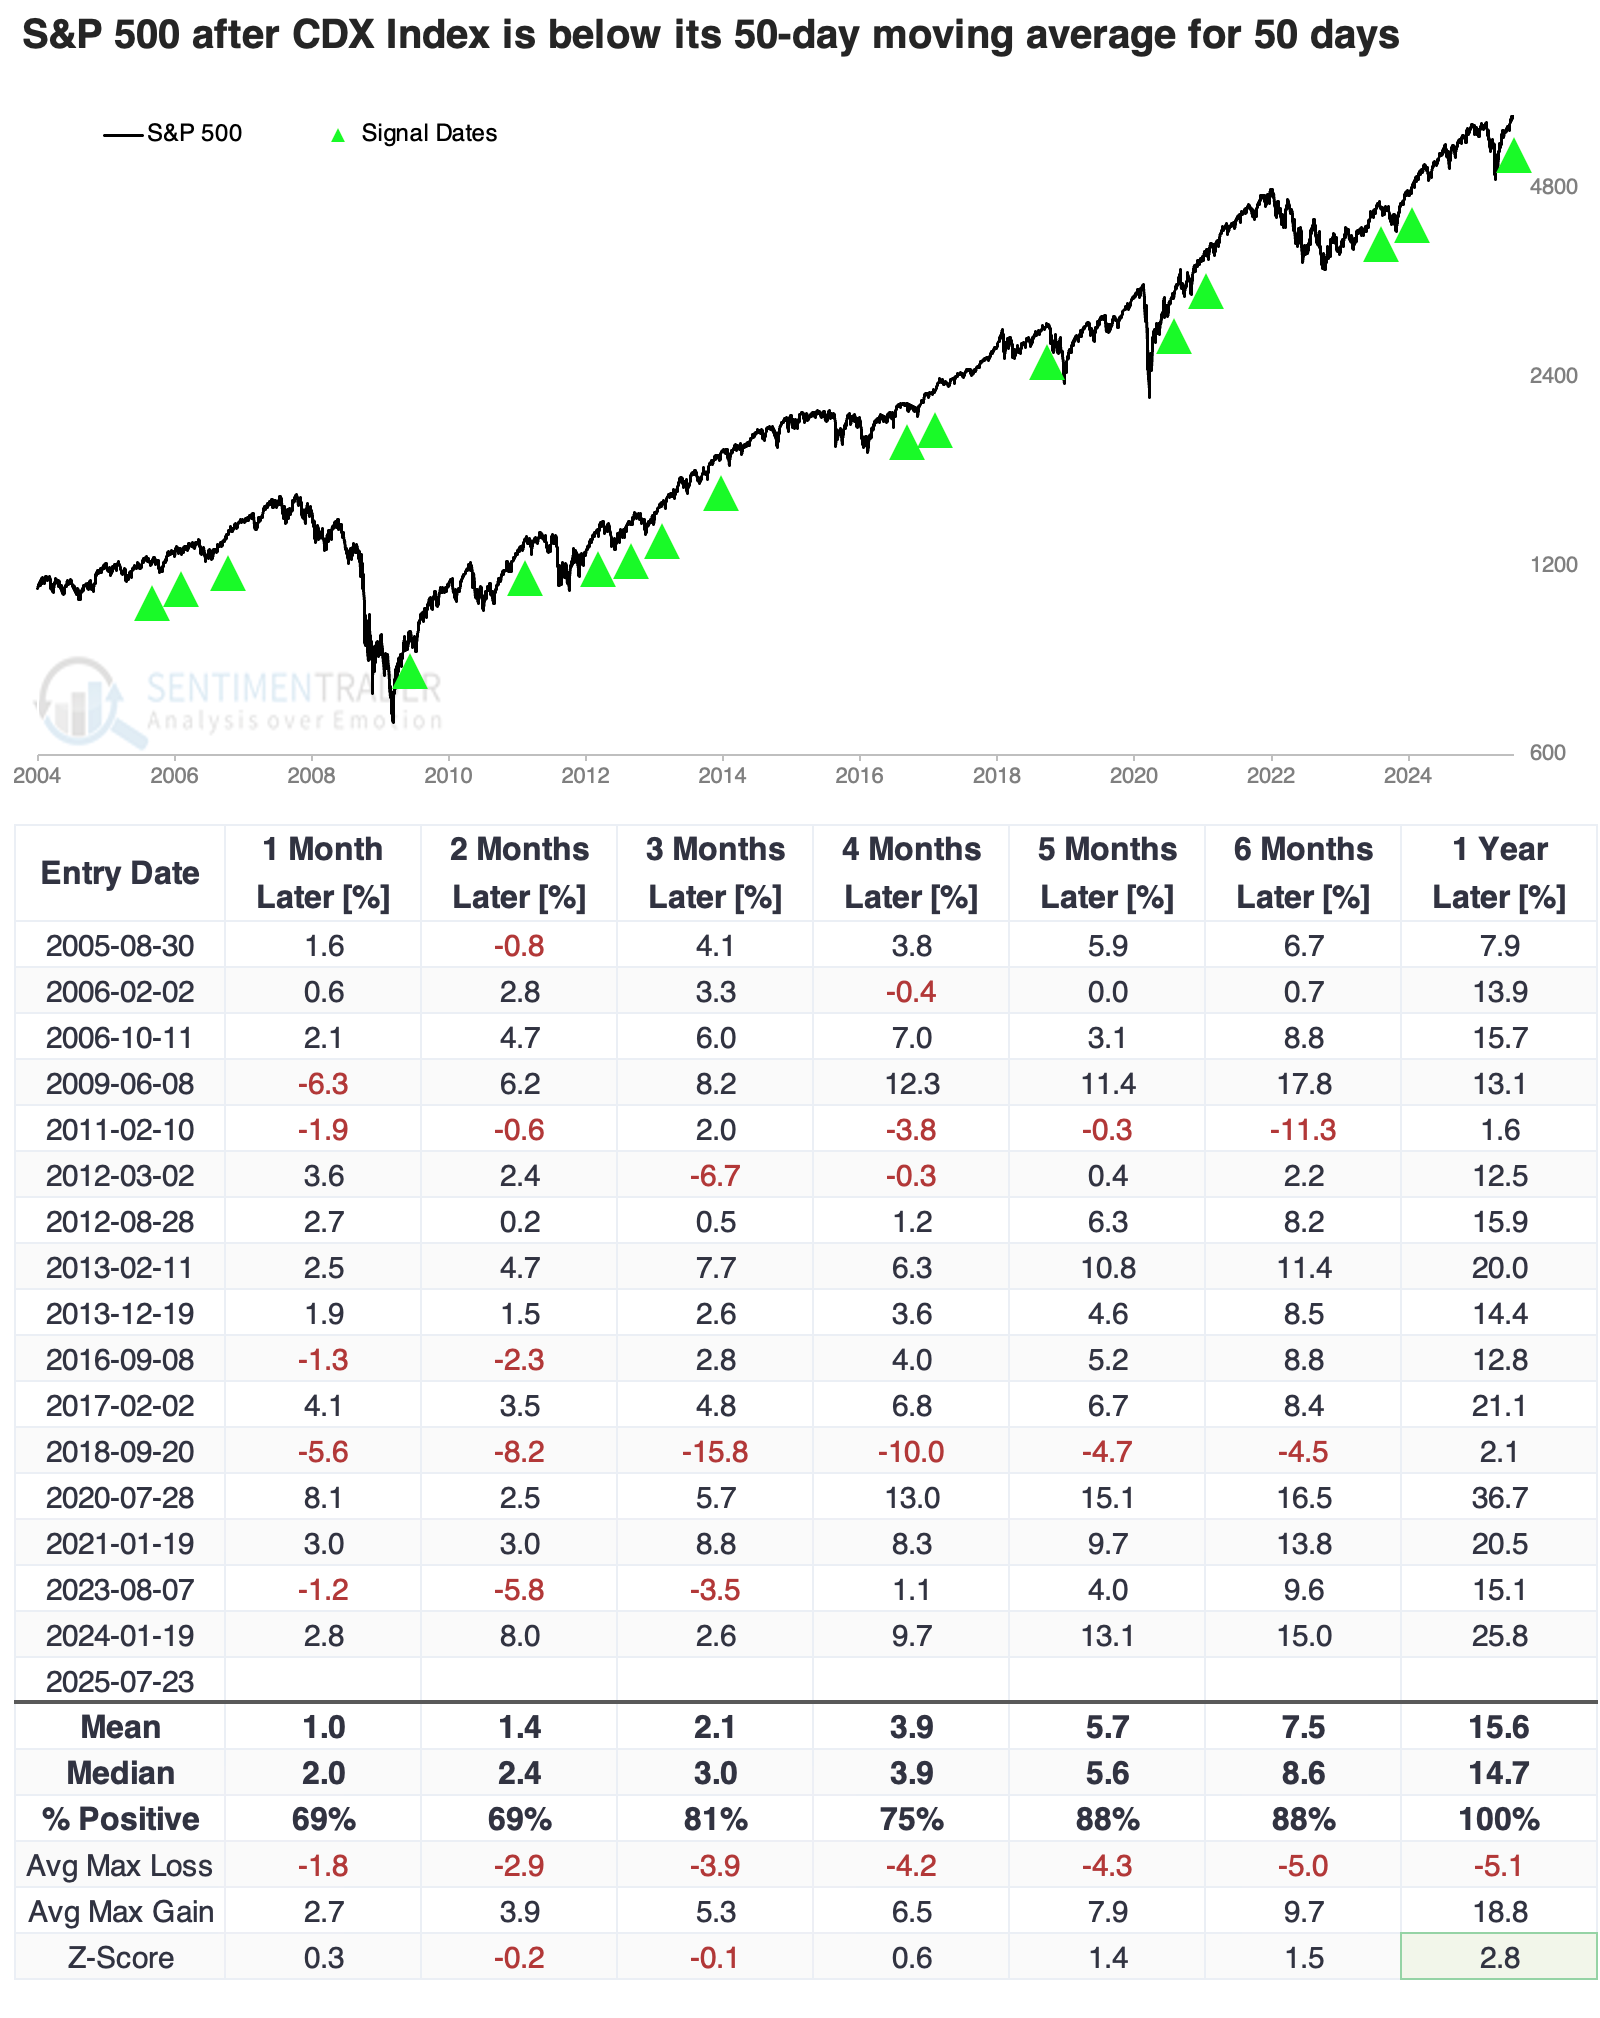
And by one good measure, bond traders haven't been concerned. A primary indicator showing the prices traders pay for default protection has been holding below its 50-day moving average for nearly 50 sessions, one of the longest streaks of the past few years. The index acts like the VIX, so if traders are concerned, the CDX Index will rise.
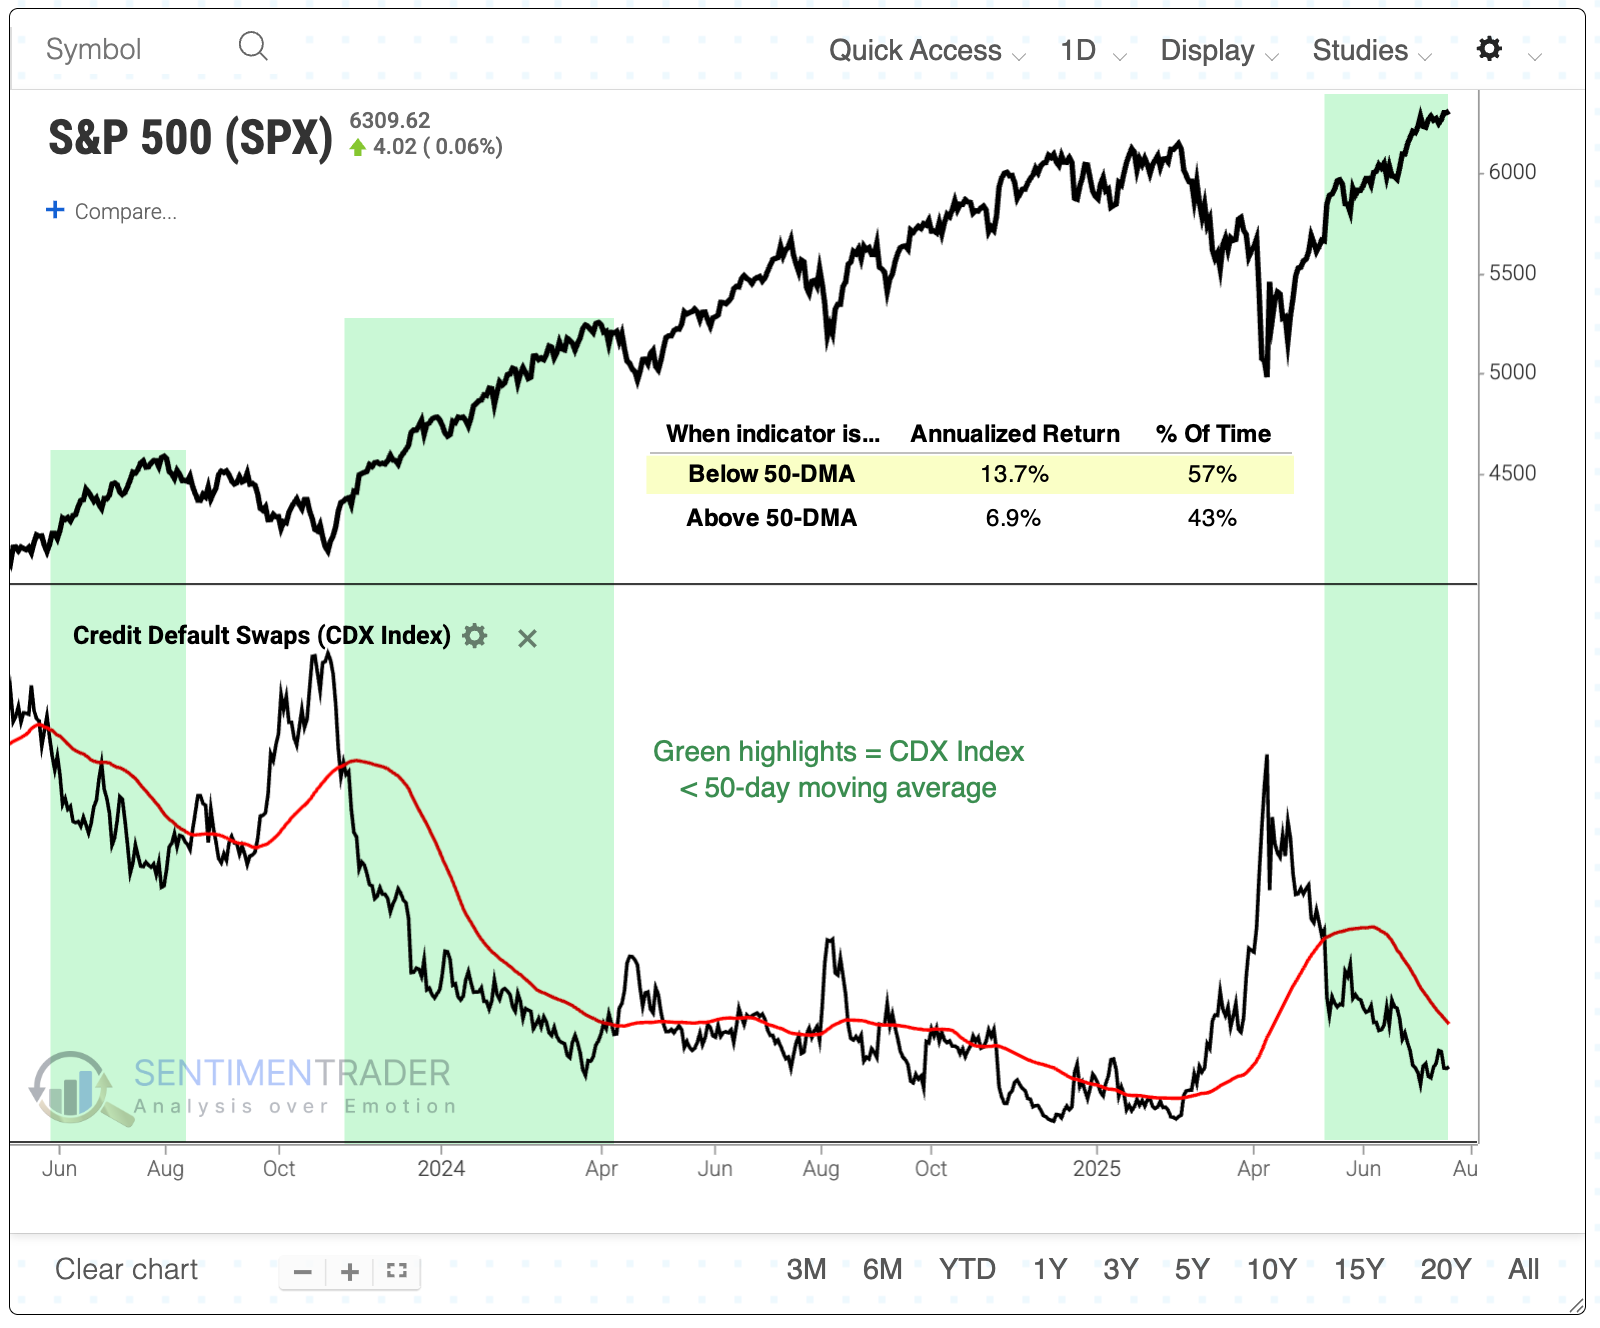
If we overlay the S&P 500 against the CDX Index, it's apparent that long streaks of calm in the bond market have coincided with happy times for stock market investors. The S&P's annualized return is double when the CDX Index is below its average compared to when it's above.
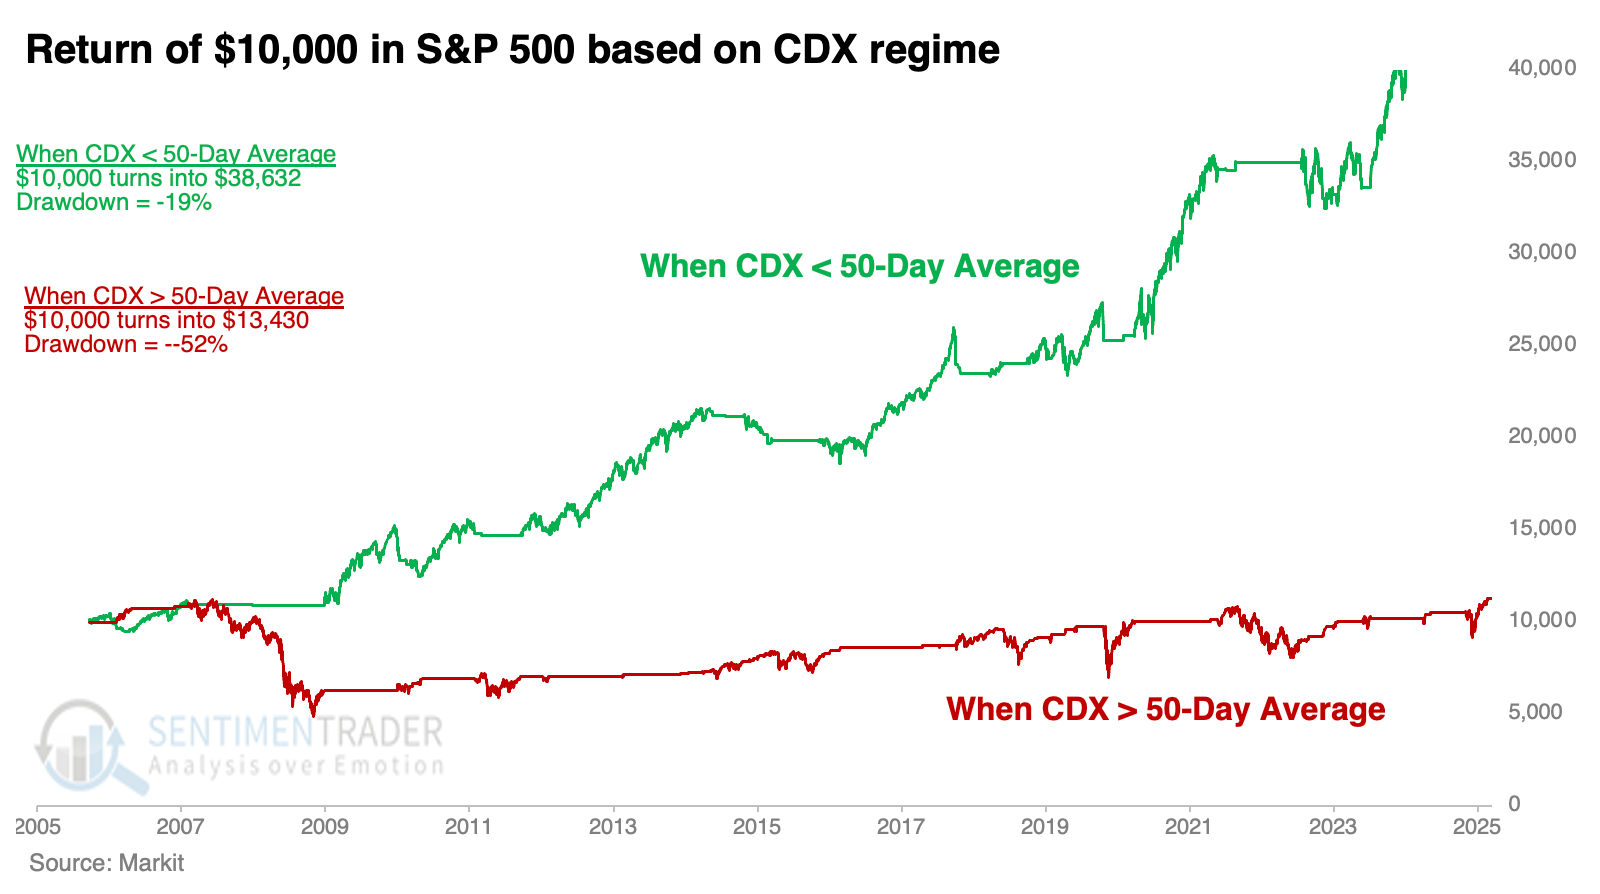
The trend in credit default prices has drastically impacted stock returns over the past 20 years. Using next-day returns, the S&P 500 turned $10,000 into nearly $40,000 when the CDX Index was below its 50-day moving average and suffered only a 19% drawdown. If the CDX Index was below its average, that $10,000 turned into only about $13,500, with a horrific drawdown exceeding 50%.
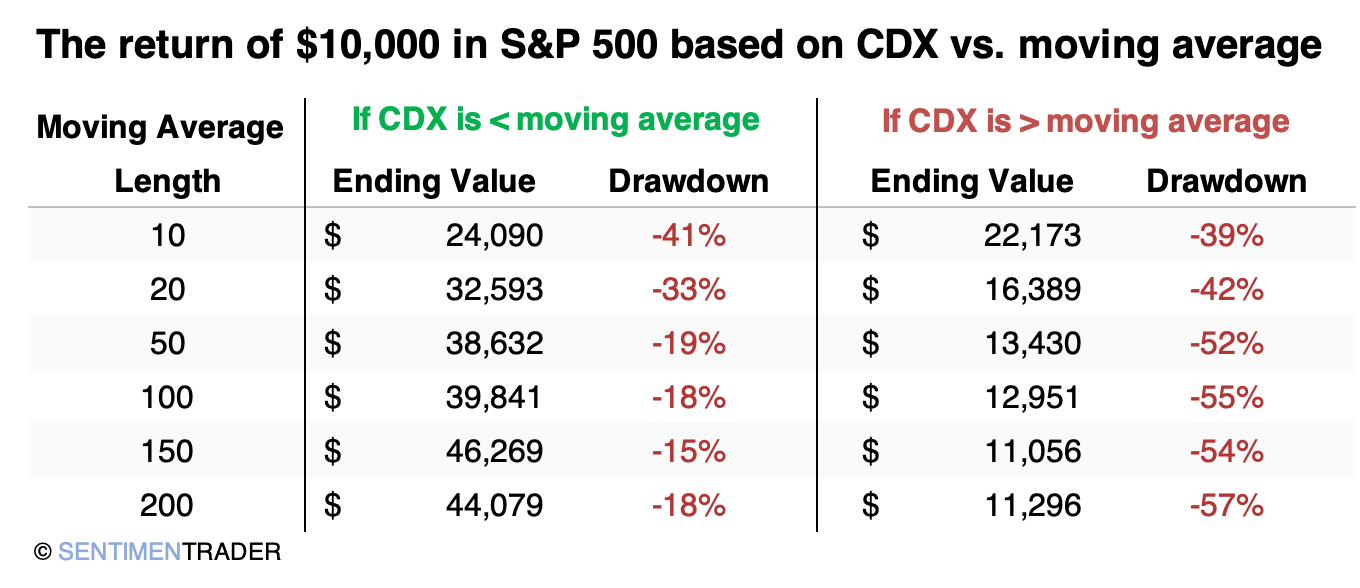
The 50-day moving average serves as a good balance between those who want or need a responsive system and those who would prefer to optimize the parameters. However, when optimizing, the 50-day average wasn't the ideal solution.
An investor in the S&P 500 would have made more money, with a slightly smaller drawdown, by monitoring the 150-day moving average on CDX Index instead of the 50-day moving average. But, again, it's a balance between optimizing past behavior and giving a decent-enough heads-up for investors on a real-time basis.
To be alerted when the CDX Index crosses above its 50-day average:
- Go to the Analysts' Backtests tab of the Backtest Engine
- Click the + button at the far right to add it to your signals
- If you wish, go to the My Signals page to confirm it has been added

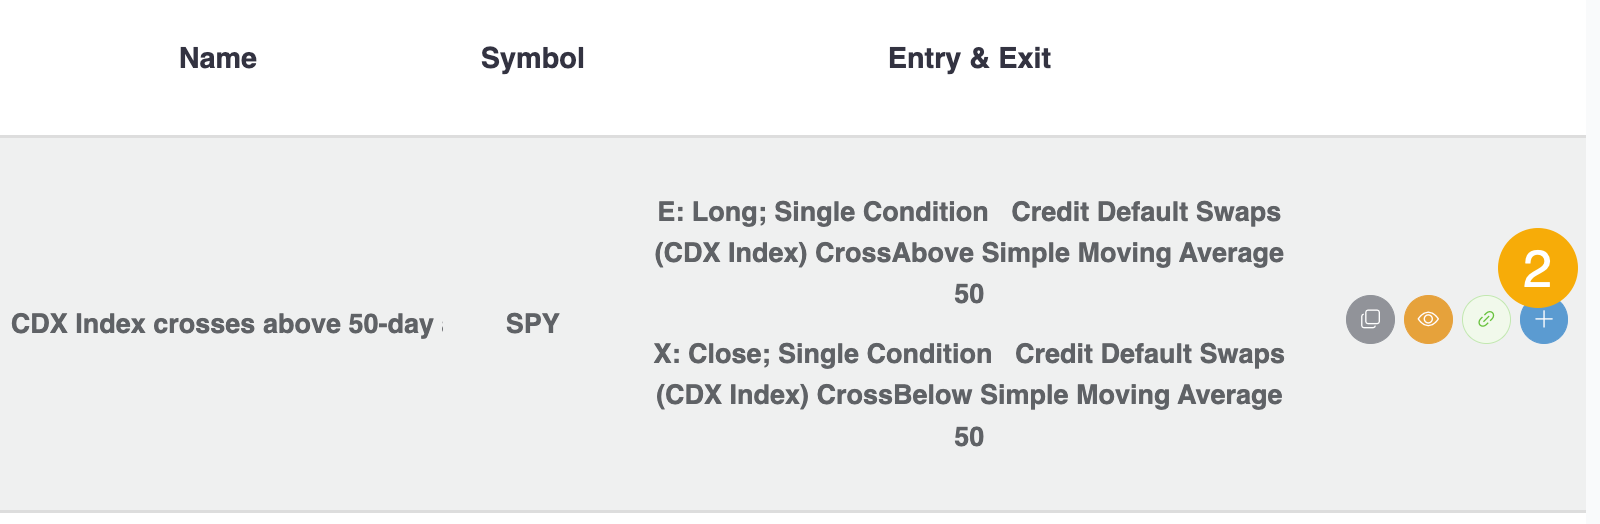
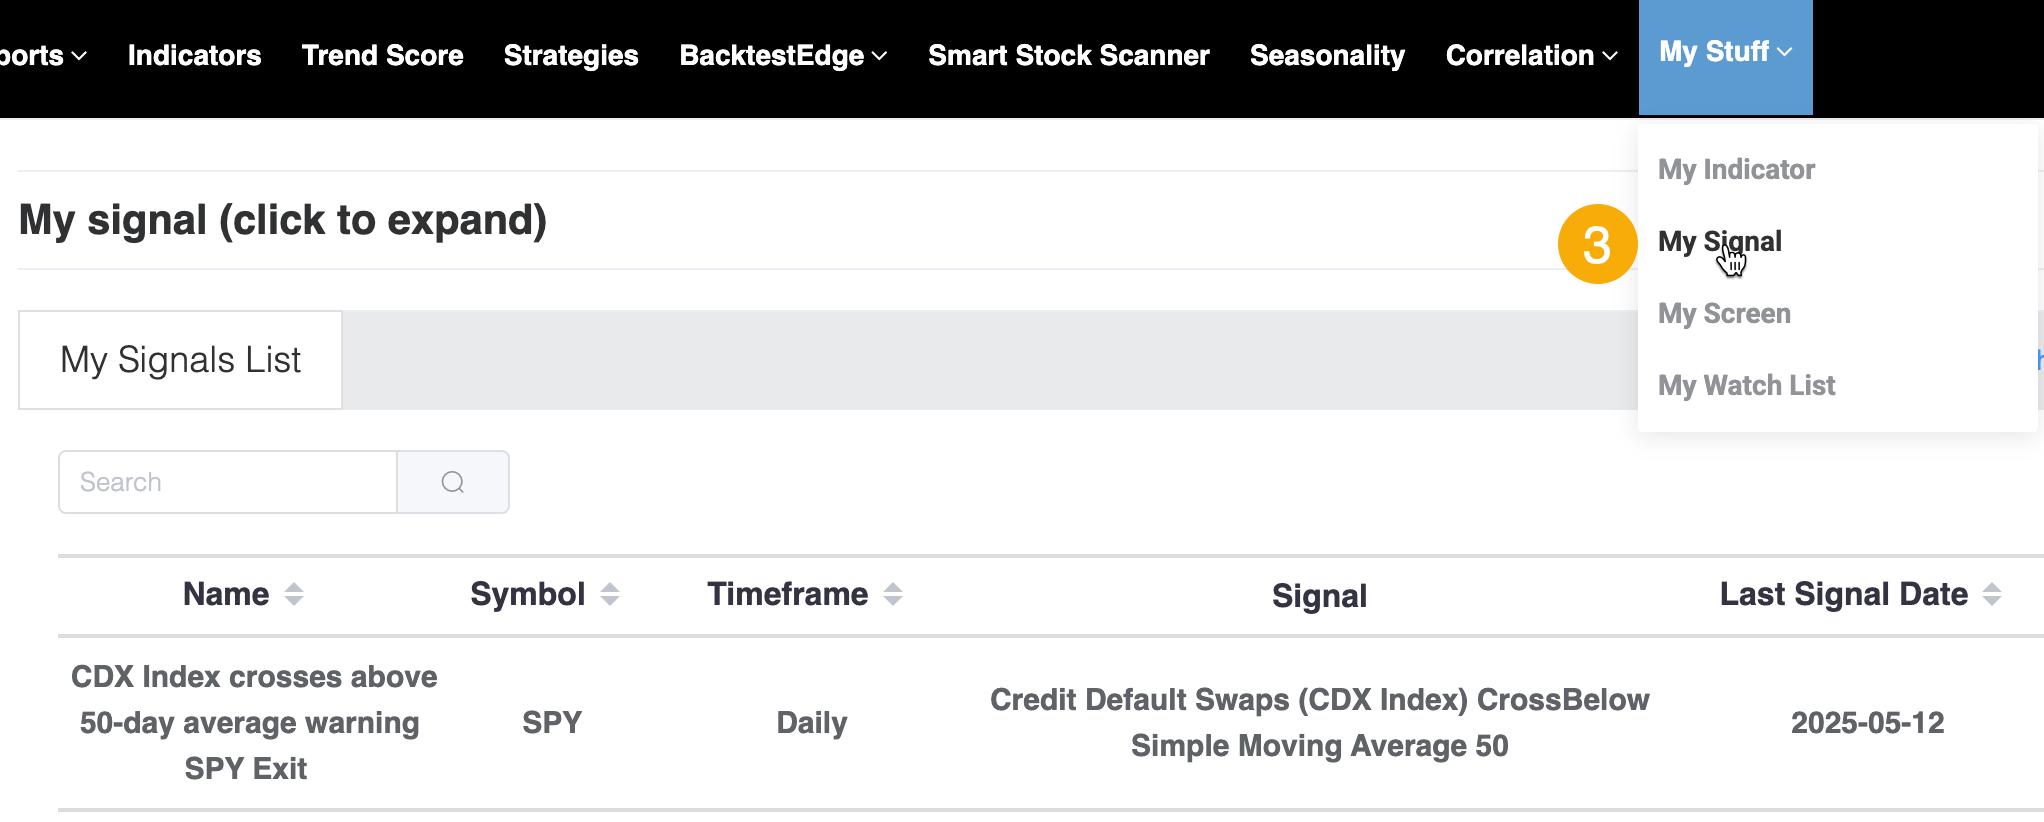
In step 2, the gray button on the left-hand side of the icons is a copy button that will add the backtest to your history. By pressing that, you can change the parameters, for example, changing the moving average to 150 days instead of 50.
It's been a while
Okay, so we know it's usually a good sign for stocks when the CDX Index hovers below its 50-day moving average.
But perhaps we should be concerned that it has been below average for soon-to-be 50 sessions already. Maybe it's gone too far, too fast. After all, this streak is on the upper end of its historical range.
The S&P 500 didn't show much of an adverse reaction in the short term. Up to three weeks later, its returns were a bit above random, and it rose most of the time. It only gained more than 5% once and lost more than 5% once, so it was pretty hum-drum.
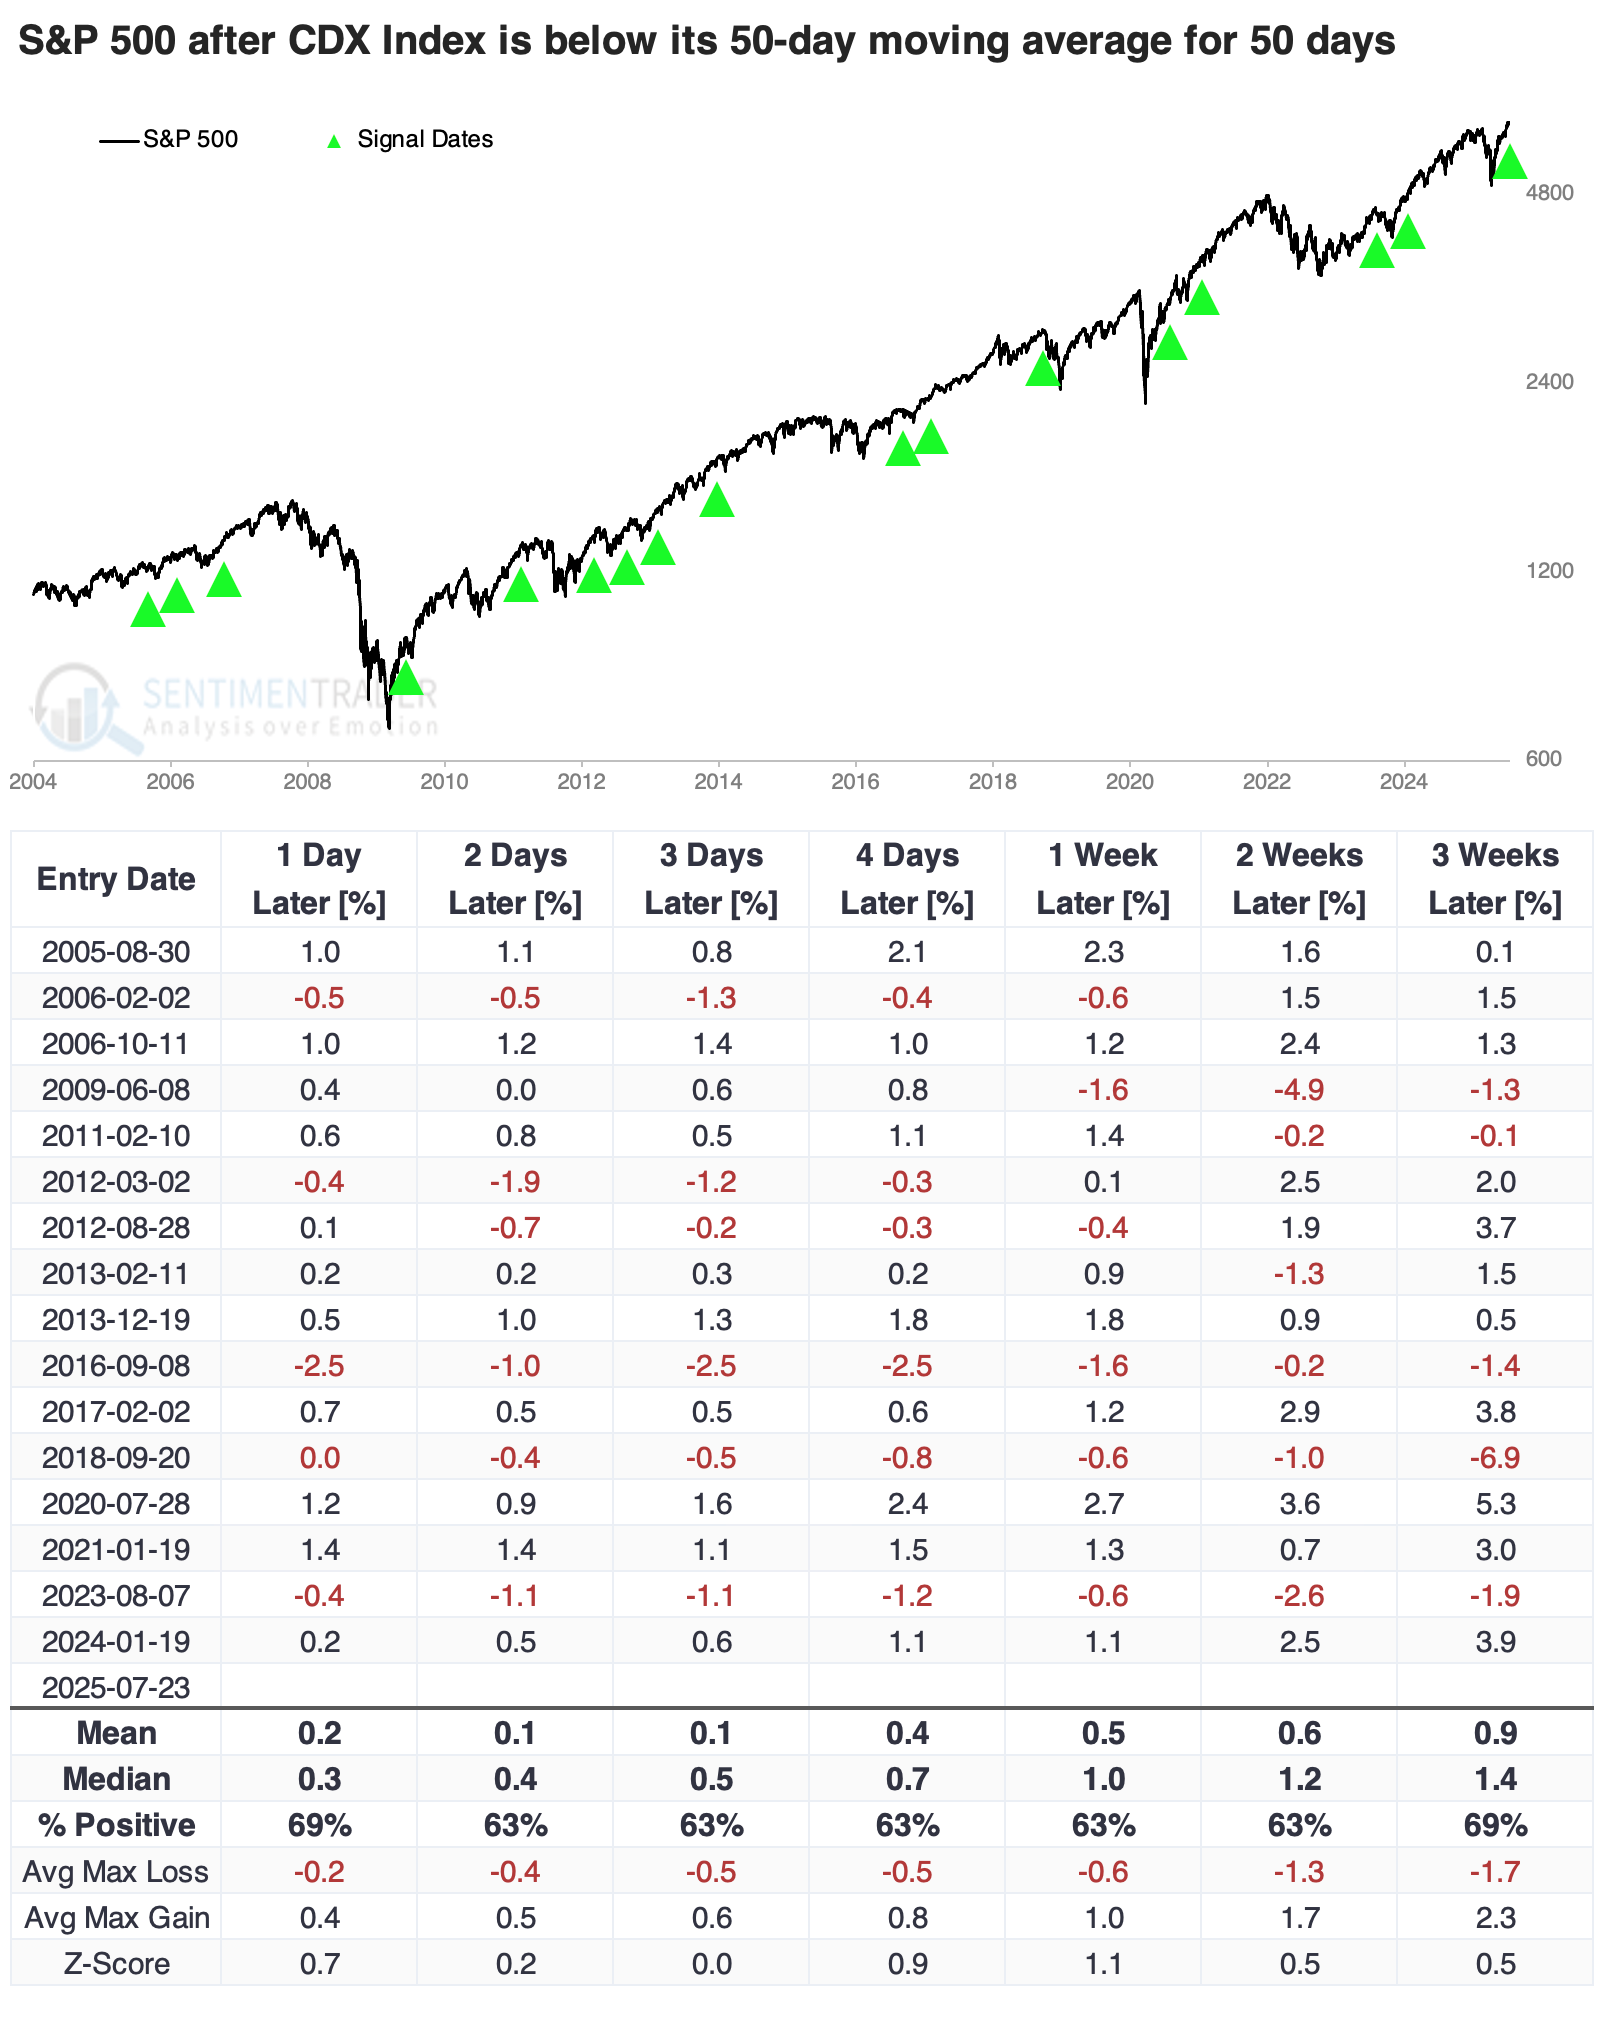
Returns were more impressive over longer time frames. Not only were there no losses over the following year, but the median return was significantly higher than a random return over the past 20 years. Within the first five months, only four signals suffered a drawdown larger than 5%, while eleven gained more than 5%.
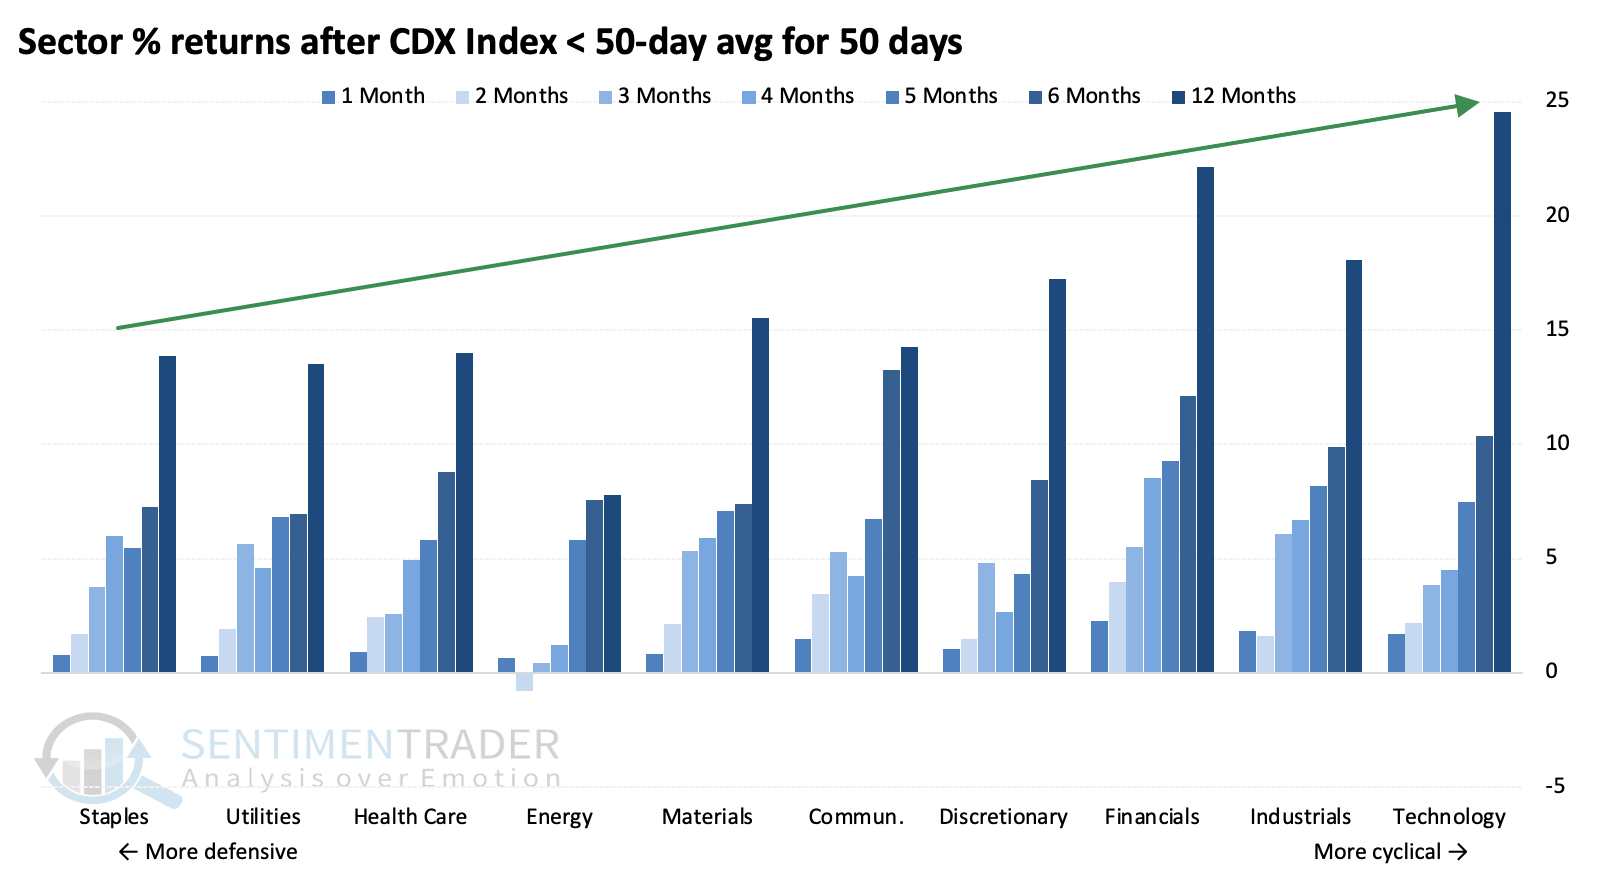
From five months and beyond, consumer staples and utilities showed positive returns at least 90% of the time. However, they did not enjoy anywhere near the best median returns. There was a clear trend benefiting more cyclical sectors on longer time frames, which makes sense given their dominance over much of the past two decades, and furthering their recent bullish momentum. For protection against losses, defensive sectors were the place to be; for the best chance at higher returns, cyclical ones were.
What the research tells us...
After stocks have had a significant run, looking for reasons to become more defensive is natural. It's how we spend much of our time. So far, there has been little to confirm that a more defensive stance is prudent, given the type of stocks doing well and the momentum in major indices.
The credit market often gives stock investors a good heads-up that things are not all rosy in the economy. When bond traders sense trouble, they usually head first to the credit default market to buy protection. There have been several periods in the past two decades when the CDX Index rose (or persisted higher) before the VIX. Currently, the CDX Index shows no strain, a tailwind for stocks. Even the fact that it has been below average for this long hasn't been a concern. When the index rises, it will be more of a yellow flag for stocks.