
A bullish market message from cyclical industries

Key points:
- The percentage of cyclical sub-industry groups with a positive one-year return increased above 80%
- Favorable price momentum in economically sensitive groups supports a bullish market outlook
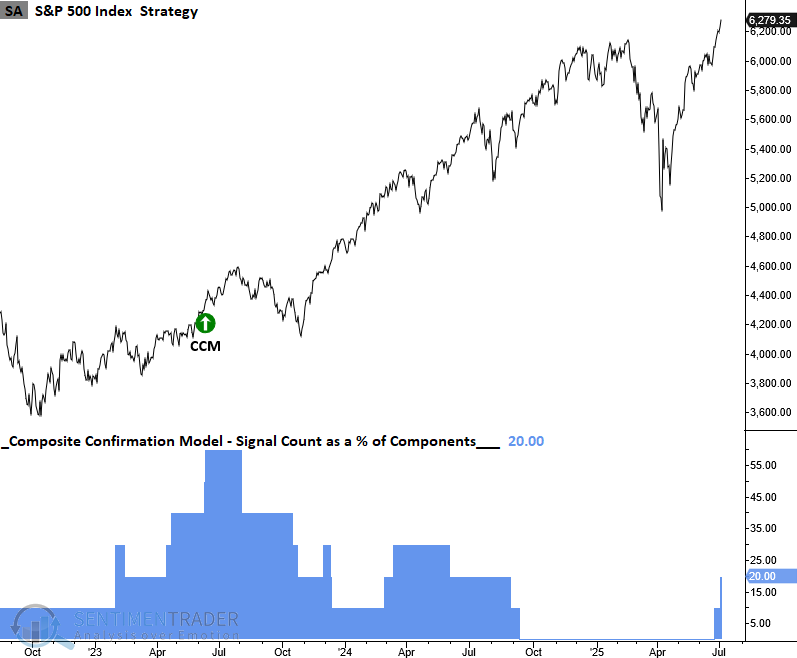
- With the new alert, the TCTM Composite Confirmation Model signal count increased to 20%
Cyclical industries lend additional support to the ongoing upswing in equities
A component in the TCTM Composite Confirmation Model issued a new alert after the percentage of cyclical sub-industry groups with a positive one-year return cycled from below 20% to above 80%, indicating that most economically sensitive industries exhibit favorable long-term price momentum.
As illustrated in the chart below, when at least 80% of cyclical groups show positive momentum, the S&P 500 has historically produced an annualized return of 17%, more than twice the return achieved when fewer groups participate.
The price momentum observed across cyclical industries from a breadth perspective lends weight to Jason's recent report, highlighting sector breakouts, indicating that both internal and external conditions continue to favor a broad market advance.
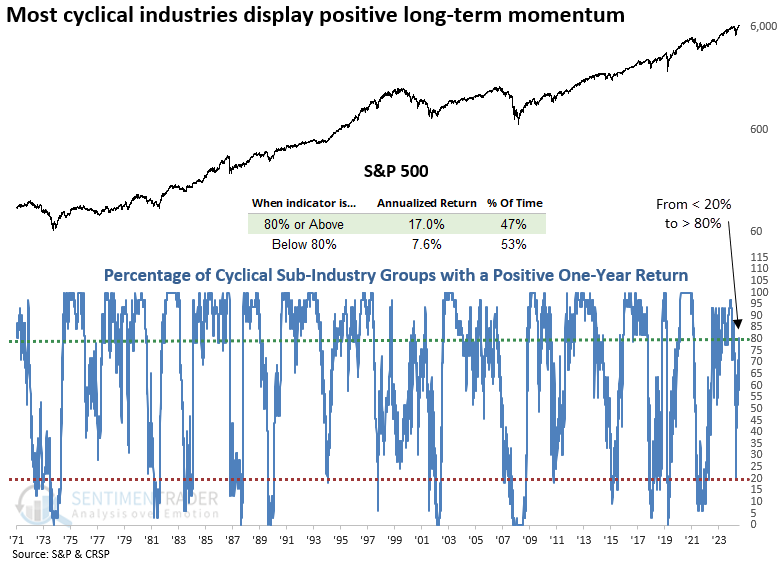
The cyclical sub-industry composite comprises 31 groups, covering autos, housing, travel, banking, construction, transportation, semiconductors, and several other industries.
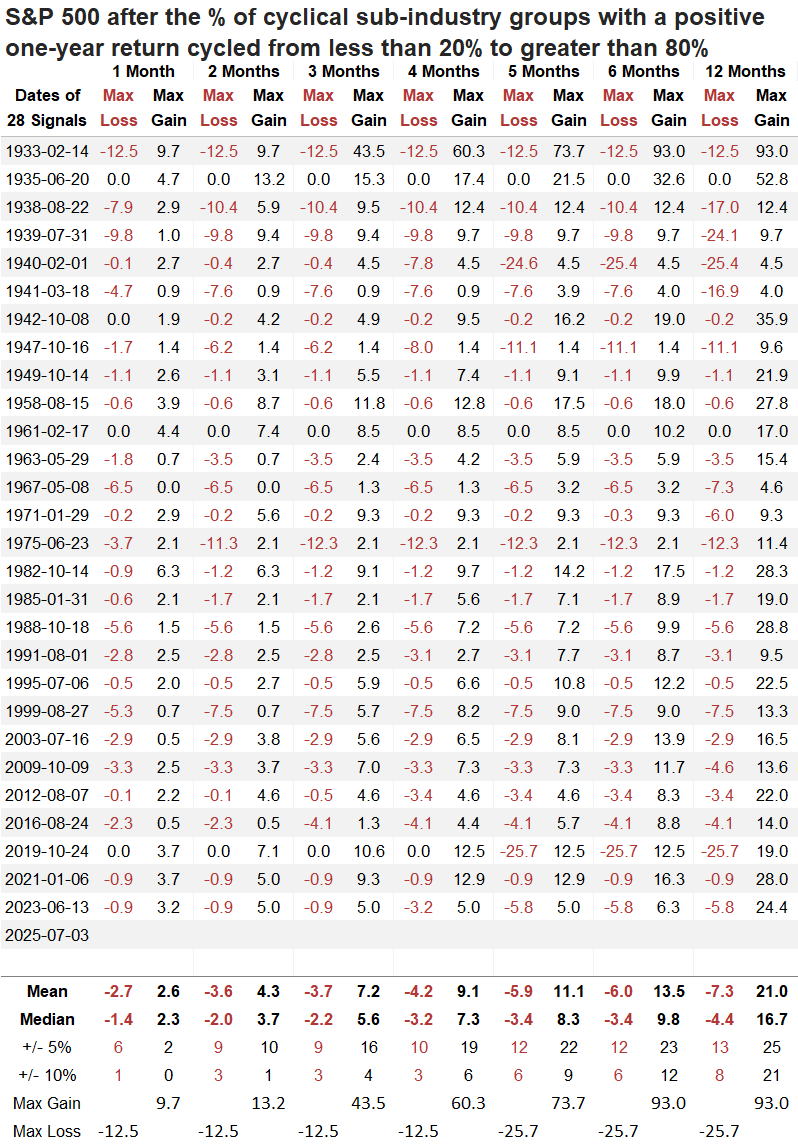
Similar recoveries in long-term price momentum preceded positive returns
Each time the proportion of cyclical sub-industry groups with a positive one-year return swung from fewer than 20% to more than 80%, the world's most benchmarked index rallied over the following year in 86% of cases. Since 1941, the S&P 500 has posted gains every year, notching 22 consecutive advances, a remarkable winning streak.
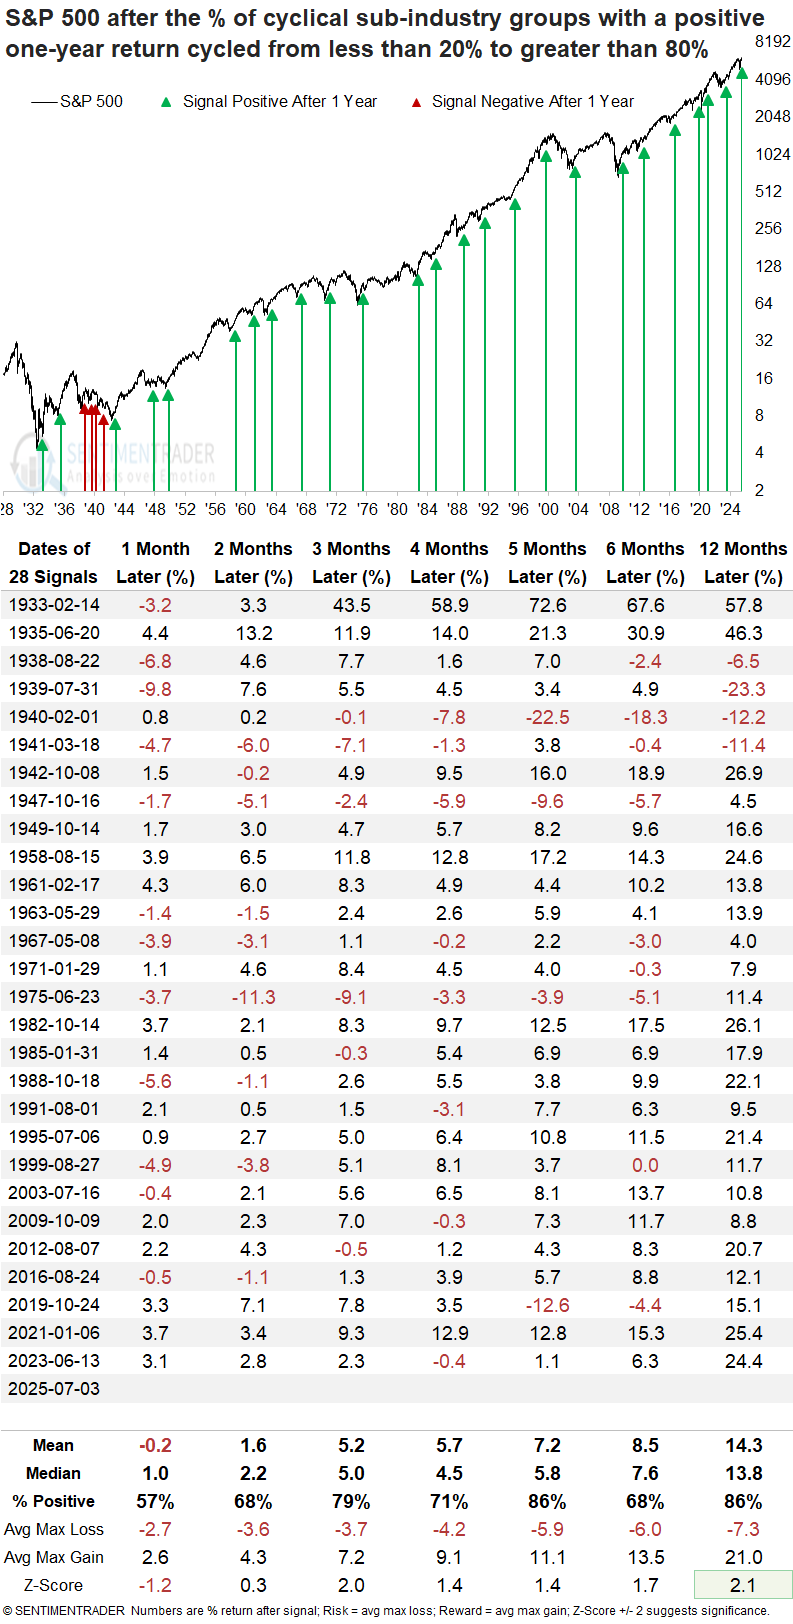
Over the following year, the S&P 500 experienced declines of more than 10% on eight occasions, while it rose by more than 10% in 21 instances. The balance of outcomes was favorable, though not decisively so, consistent with the nature of recovery or continuation signals that are less timely than breadth thrusts.
Cyclical sectors dominate the new highs list
As the S&P 500 notched its fourth record high in five sessions last Thursday, a notable skew in new highs among its constituents favored cyclical sectors, indicating broad participation from economically sensitive stocks, a hallmark of sustainable uptrends.
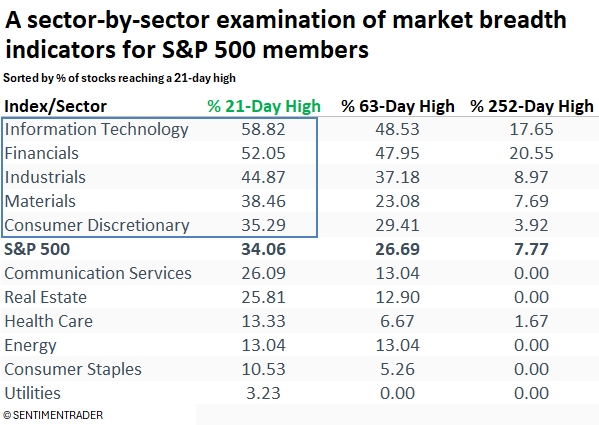
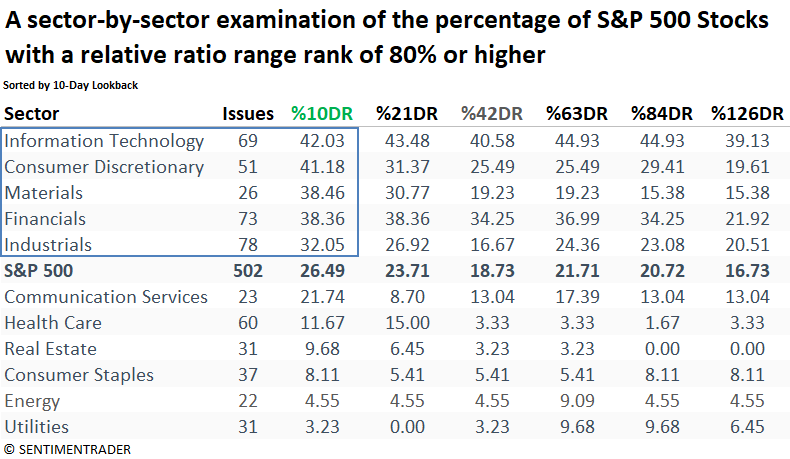
Relative trend breadth favors cyclical stocks
Cyclical sectors maintain a dominant presence among stocks trading near their relative highs across short-, medium-, and long-term horizons.
The TCTM Composite Confirmation Model ticks up
Following the latest alert, the TCTM Composite Confirmation Model signal count increased to 20%, which remains below the 50% threshold required to trigger a broad composite signal.
What the research tells us...
The percentage of cyclical sub-industry groups with a positive one-year return shifted from below 20% to over 80%, indicating an improvement in long-term price momentum in economically sensitive industries. Historically, similar momentum reversals have marked strong market environments, with the S&P 500 posting a positive return 100% of the time over the following year since 1941. This latest signal adds further credence to the bullish backdrop for equities, reinforcing the case for a durable uptrend. For now, dips should be bought, focusing on offense-oriented stocks and ETFs exhibiting bullish relative strength.