
No Spike In New Highs - What It Means

A sparse new high list
The S&P 500 has been hanging near its former high, but relatively few securities on the NYSE have been able to push above their former peaks.
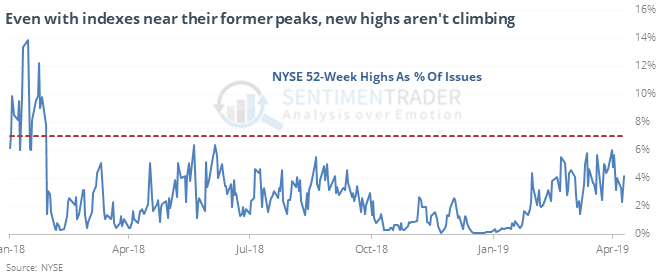
It’s now been 300 days since more than 7% of issues on the NYSE hit a new high, ranking as one of the longest stretches in 50 years. This kind of behavior was almost universally negative prior to the financial crisis. Since then, it has triggered five other times, all leading to positive two-month returns, but it wasn't quite that clean.
Commodities are climbing
For the first time in almost 6 months, the Bloomberg Commodity Index closed above its 200-day average.
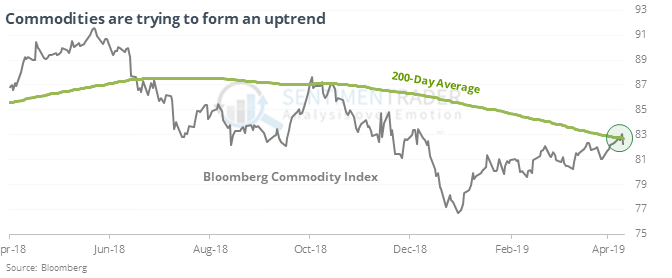
That’s a fairly long stretch below average. After other times it hit a multi-year low then ended a long streak below its average, future returns were okay, but it wasn’t a consistent buy signal.
Slippery
It’s been a good sign, especially longer-term, when crude oil recovers from a sharp decline. In the shorter-term, sentiment has rebounded enough, within a still-questionable long-term trend, that the Risk Level has risen to 8. The Backtest Engine shows that over the past 5 years, a Risk Level of 8 or higher led to gains in oil only 37% of the time during the next two weeks. Even over the past 10 years, it gained only 40% of the time.
Lots of extremes (again)
More than 45% of our core indicators are now showing excessive optimism. Over the past 20 years, when there were this many extremes, the S&P’s two-month average return was negative. Most dates showed a negative return somewhere between 1-3 months.
This post was an abridged version of our previous day's Daily Report. For full access, sign up for a 30-day free trial now.