Products
SentimenTrader Trading Tools
‍
Backtest Engine
My Trading Toolkit
Correlation Analysis
Seasonality
Market Prediction
Indicators & Data API
‍
Proprietary Indicators & Charts
Market Data API
Strategies & Scanner
‍
50+ Trading Strategies
Smart Stock Scanner
Smart Option Scanner
Research Reports
‍
Research Solutions
Reports Library
Free Resources
Simple Backtest Calculator
Simple Seasonality Calculator
The Kelly Criterion Calculator
Sentiment Geo Map
Public Research Reports
Education
Sentiment Indicators
Technical Indicators
Pricing
Company
About
In the News
Testimonials
Client Success Stories
Contact
Log inLoginSign up
< BACK TO ALL REPORTS

Newsletters Throw In The Towel; Record Reversals

Jason Goepfert
2019-01-03
null

This is an abridged version of our Daily Report.

Throwing in the towel

Over the past decade, it has taken some severe moves in stocks, in a very short amount of time, to shake optimism among newsletter writers. That’s what happened now, with a near-record drop in sentiment. 

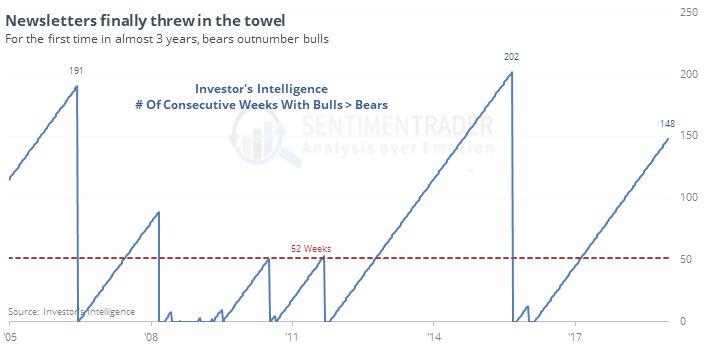
For the first time in nearly 3 years, there are now more letters looking for stocks to decline than rally. That has usually meant it’s going to do the opposite. 

This week’s reading also ranks as the 3rd-largest change in the Bull Ratio in the survey’s history. It has been nearly 30 years since the Bull Ratio dropped more than 12 percentage points in a single week. This time, it was more than 18 points. Using a 3-year lookback range, this week was nearly 3 standard deviations from normal.

Record reversals

The big drop and reversal last week triggered a record number of reversals among S&P 500 stocks, by a long shot. Nearly half of the stocks set a 52-week low before reversing to close higher. That has only occurred during panicky markets, which typically meant a medium-term recovery.

Nervous nellies

The S&P 500 fund, SPY, gapped down more than 1% before reversing to close up for the day. This is occurring within two weeks of a 52-week low. Investors are nervous. In SPY’s history, it has happened 14 other times, almost all of which were in 2002 and 2008.

Stretched for a month

The Stock/Bond Ratio has been extreme for a month now. The 20-day average is below -2.5 for the first time since 2011. The Backtest Engine shows that there have been 50 days since 1969 when it has been this extreme, leading to a rally in the S&P 500 over the next two months after 43 of them.

PRODUCTS
SentimenTrader
Trading Tools
Indicators & Data API
‍
Strategies & Scanner
‍
Research Reports
FREE
RESOUrCES
Simple Backtest
Calculator
Simple Seasonality
Calculator
The Kelly Criterion
Calculator
Sentiment Geo Map
‍
Public Research Reports
‍
Education
Sentiment Indicators
‍
Technical Indicators
‍
Pricing
Bundle pricing
‍
FAQ
‍
Announcements
‍
COMPANY
‍
About
‍
In the News
‍
Testimonials
‍
Client Success Stories
CONTACT
‍
General Inquiries
‍
Media Inquiries
‍
Financial Professionals Inquiries
‍
© 2026 Sundial Capital Research Inc. All rights reserved.
Setsail Marketing
TermsPrivacyAffiliate Program
Risk Disclosure: The information and tools provided are for research and analytical purposes only and are not intended as investment advice. Market analysis involves uncertainty, and outcomes may differ from expectations. Users should conduct their own due diligence and consider their individual circumstances before making any financial decisions. Past performance is not necessarily indicative of future results.

Hypothetical Performance Disclosure: Hypothetical performance results have many inherent limitations, some of which are described below. No representation is being made that any account will or is likely to achieve profits or losses similar to those shown; in fact, there are frequently sharp differences between hypothetical performance results and the actual results subsequently achieved by any particular trading program. One of the limitations of hypothetical performance results is that they are generally prepared with the benefit of hindsight. In addition, hypothetical trading does not involve financial risk, and no hypothetical trading record can completely account for the impact of financial risk of actual trading. for example, the ability to withstand losses or to adhere to a particular trading program in spite of trading losses are material points which can also adversely affect actual trading results. There are numerous other factors related to the markets in general or to the implementation of any specific trading program which cannot be fully accounted for in the preparation of hypothetical performance results and all which can adversely affect trading results.

Testimonial Disclosure: Testimonials appearing on this website may not be representative of other clients or customers and is not a guarantee of future performance or success.