Data &
Technology
Research
Reports
Report Solutions
Reports Library
Actionable
Strategies
Free
Resources
Simple Backtest Calculator
Simple Seasonality Calculator
The Kelly Criterion Calculator
Sentiment Geo Map
Public Research Reports
Free Webinar
Pricing
Company
About
Meet Our Team
In the News
Testimonials
Client Success Stories
Contact
Log inLoginSign up
< BACK TO ALL REPORTS

Newsletter writers are uber-bullish on stocks

Dean Christians
2024-07-09
For only the 13th time since 1971, the percentage of newsletter writers with a positive outlook on stocks cycled from below 35% to above 63%, indicating heightened optimism. Comparable sentiment conditions suggest the S&P 500 could struggle over the next few weeks, though the long-term outlook remained positive.

Key points:

  • The percentage of bulls in the Investors Intelligence sentiment survey increased above 63%
  • Similar periods with a high level of bulls preceded a multi-week pullback/consolidation for the S&P 500
  • A broad sentiment composite indicates that the upward momentum in the S&P 500 may decelerate

The granddaddy of sentiment surveys shifts to extreme optimism 

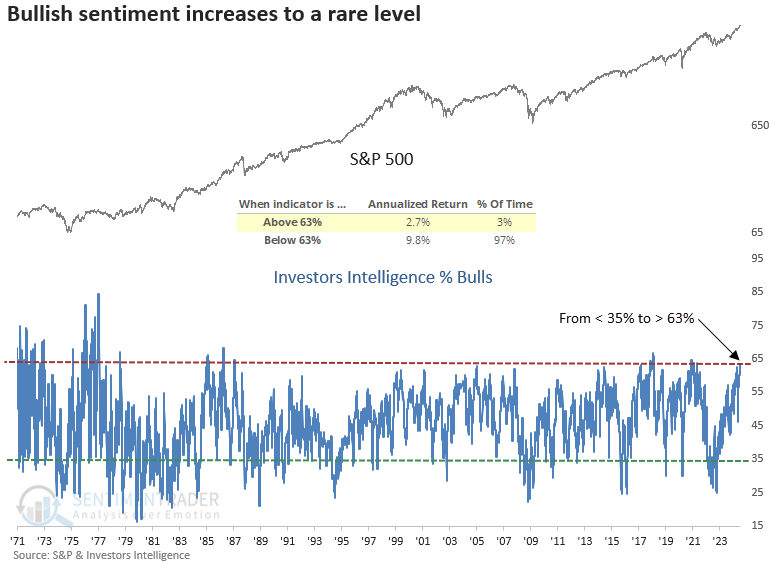
Last week, Investors Intelligence released its weekly sentiment survey, which measures the percentage of newsletter writers that are bullish, bearish, or neutral on the stock market.

For the first time since the bear market low in 2022, the percentage of survey members with a bullish outlook increased above 63%, a level obtained only 3% of the time since 1971. 

The chart below shows that readings above 63% produced annualized returns of 2.7%, far less than those below that level and the 7.9% annualized return (price-only) for the S&P 500 since 1971.

A significant number of bulls often led to a challenging short-term outlook for stocks

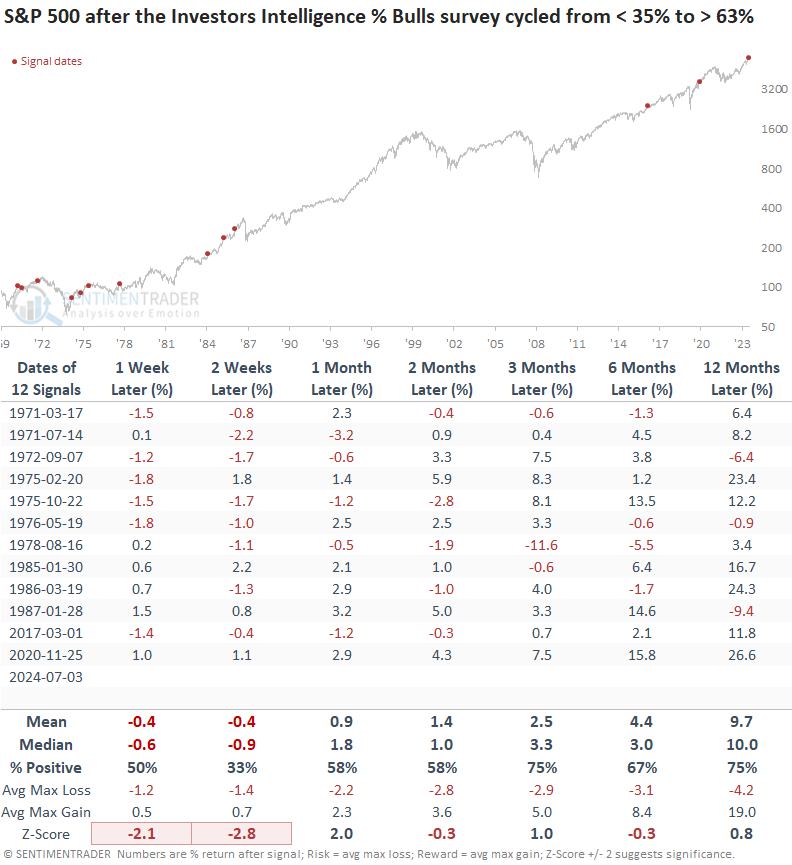
Whenever bullish sentiment in the Investors Intelligence survey cycled from below 35% to above 63%, the S&P 500 tended to struggle in the ensuing two weeks, posting a win rate of only 33%. 

After the setback, stocks rebounded over the next three months, gaining 75% of the time with a median increase of 3.3%. During this period, the world's most benchmarked index experienced only one significant loss of over -10%, which happened in 1978. 

A broad composite shows bullish sentiment

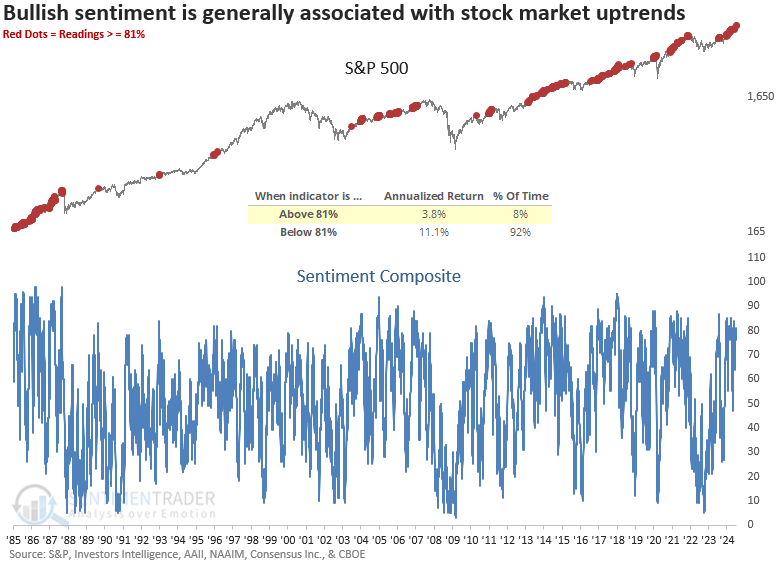
A composite that contains sentiment indicators from Investors Intelligence, the American Association of Individual Investors, the National Association of Active Managers, Consensus Inc., and the CBOE currently resides at 81%, a level exhibited in only 8% of instances since 1983.

When the composite surpasses 81%, the S&P 500 displays an annualized return of 3.8%, less than half the index's annualized return since 1983. 

What the research tells us...

The Investors Intelligence survey, the oldest of its kind, indicates a notable increase in bullish sentiment. Historically, such readings have often been followed by short-term challenges for the S&P 500, though the long-term outlook has remained positive. Typically, bullish sentiment persists until an unexpected event surprises market participants, prompting them to reconsider their positive stance. Predicting what will trigger this shift is impossible, which is why it's most effective to wait until the indicators reverse from an extreme. 

Sorry, you don't have access to this report

Upgrade your subscription plan to get access
Go to Dasboard
DATA &
TECHnologies
IndicatorEdge
‍
BackTestEdge
‍
Other Tools
‍
DataEdge API
RESEARCH
reports
Research Solution
‍
Reports Library
‍
actionable
Strategies
Trading Strategies
‍
Smart Stock Scanner
‍
FREE
RESOUrCES
Simple Backtest
Calculator
Simple Seasonality
Calculator
The Kelly Criterion
Calculator
Sentiment Geo Map
‍
Public Research Reports
‍
Free Webinar
COMPANY
‍
About
‍
Meet our Team
‍
In the News
‍
Testimonials
‍
Client Success Stories
Pricing
Bundle pricing
‍
Announcements
‍
FAQ
© 2024 Sundial Capital Research Inc. All rights reserved.
Setsail Marketing
TermsPrivacyAffiliate Program
Risk Disclosure: Futures and forex trading contains substantial risk and is not for every investor. An investor could potentially lose all or more than the initial investment. Risk capital is money that can be lost without jeopardizing ones’ financial security or life style. Only risk capital should be used for trading and only those with sufficient risk capital should consider trading. Past performance is not necessarily indicative of future results.

Hypothetical Performance Disclosure: Hypothetical performance results have many inherent limitations, some of which are described below. No representation is being made that any account will or is likely to achieve profits or losses similar to those shown; in fact, there are frequently sharp differences between hypothetical performance results and the actual results subsequently achieved by any particular trading program. One of the limitations of hypothetical performance results is that they are generally prepared with the benefit of hindsight. In addition, hypothetical trading does not involve financial risk, and no hypothetical trading record can completely account for the impact of financial risk of actual trading. for example, the ability to withstand losses or to adhere to a particular trading program in spite of trading losses are material points which can also adversely affect actual trading results. There are numerous other factors related to the markets in general or to the implementation of any specific trading program which cannot be fully accounted for in the preparation of hypothetical performance results and all which can adversely affect trading results.

Testimonial Disclosure: Testimonials appearing on this website may not be representative of other clients or customers and is not a guarantee of future performance or success.