Data &
Technology
Research
Reports
Report Solutions
Reports Library
Actionable
Strategies
Free
Resources
Simple Backtest Calculator
Simple Seasonality Calculator
The Kelly Criterion Calculator
Sentiment Geo Map
Public Research Reports
Free Webinar
Pricing
Company
About
Meet Our Team
In the News
Testimonials
Client Success Stories
Contact
Log inLoginSign up
< BACK TO ALL REPORTS

Newsletter writers are fully risk-on

Jason Goepfert
2020-12-02
The latest Investor's Intelligence survey shows that the Bull Ratio among newsletter writers is above 80% for the first time since early 2018. After the ends of other long streaks with "not euphoria," stocks continued to rise over the next 2-4 weeks.

As markets started to recover from the September swoon, optimism bounced back from almost-neutral levels. By mid-November, it climbed into excessive territory. Now there are signs it's reached a euphoric stage.

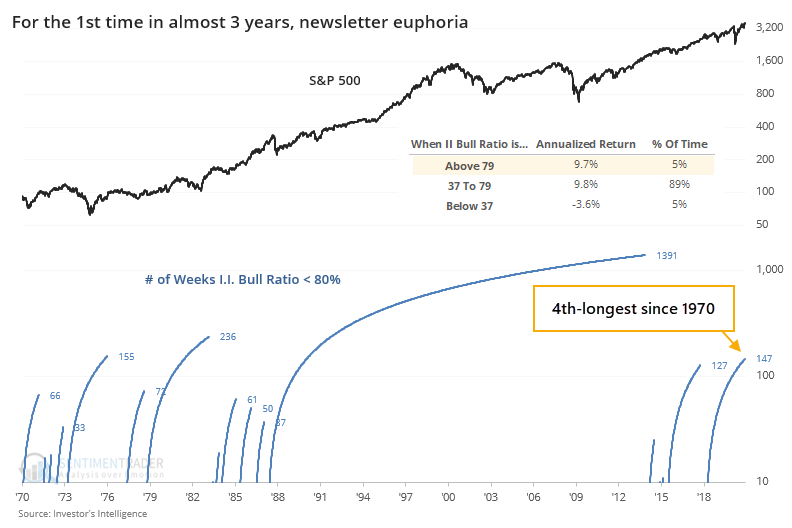
Among many examples, the latest survey of newsletter writer recommendations from Investor's Intelligence shows a Bull Ratio that's above 80% (rounded). The Bull Ratio is simply the percentage of those expecting higher prices relative to all of them that expressed an opinion either way.

This is the first time it's at 80% or above since January 2018, ending the 4th-longest streak of "not euphoria." That long streak without euphoria starting in the late 1980s was such an outlier that we had to use a log chart to show the streaks.

One of the biggest stumbling blocks with contrary analysis is the tendency to think that everything is contrarian, all the time. But we can see from the chart above that when the Bull Ratio is above 79%, where it has been on about 5% of the weeks since 1970, the S&P 500's forward return was an annualized +9.7%. When the Bull Ratio was below 37%, that return dropped to -3.6%. That's the opposite of what we should expect with a consistent contrarian indicator.

We can also see that below, looking at the S&P 500's performance after the I.I. survey reached the euphoria stage for the 1st time in at least 6 months.

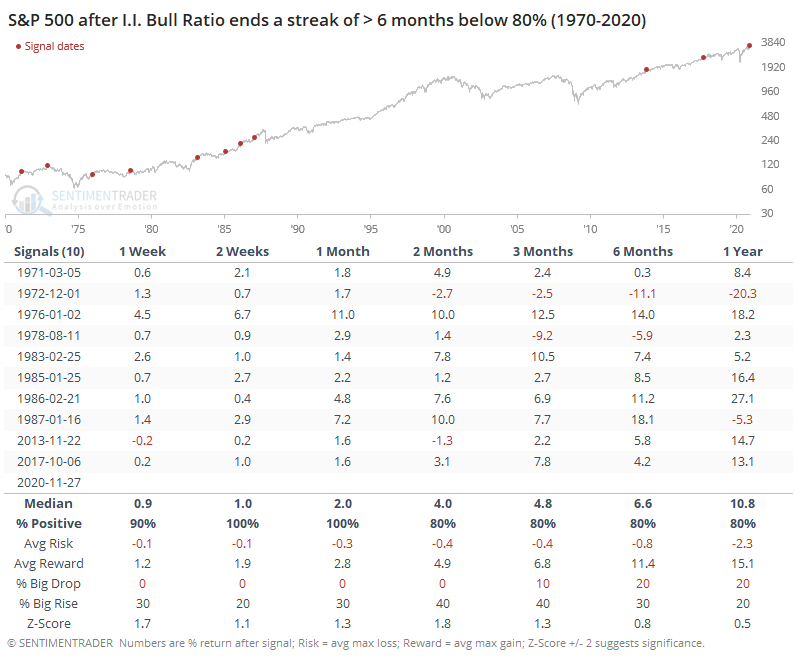
Far from being a signal to sell stocks, it was actually a decent buy signal. Once newsletters went all-in on the market, it led to further gains over the next 2-4 weeks every time, with a positively skewed risk/reward ratio and probability of a big rise vs. big drop.

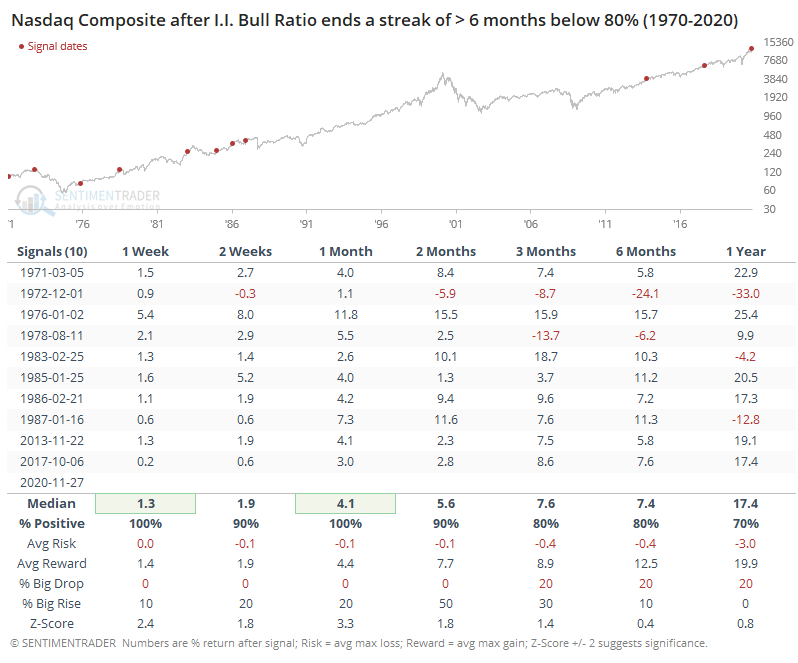
Returns in a higher-beta index like the Nasdaq Composite were even better.

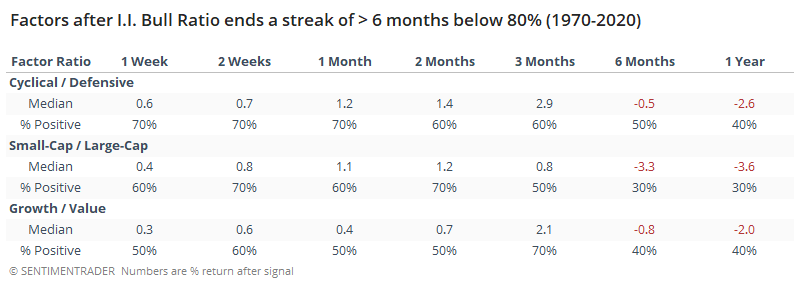
If we look at ratios of major factors, then we can also see that a risk-on attitude paid off more often than not over the short- to medium-term. By 6 months later, however, the high optimism weighed on riskier stocks relative to safer ones.

The highly optimistic results of this survey will probably trigger a lot of attention, as it's a widely-followed measure of sentiment. We can certainly cherry-pick some instances when a high level of optimism immediately preceded a big decline in stocks. Objectively, however, it has not been helpful to expect an imminent decline. And when newsletters get all bulled up like they are now, it has more consistently led to further gains over the short- to medium-term. 

Sorry, you don't have access to this report

Upgrade your subscription plan to get access
Go to Dasboard
DATA &
TECHnologies
IndicatorEdge
‍
BackTestEdge
‍
Other Tools
‍
DataEdge API
RESEARCH
reports
Research Solution
‍
Reports Library
‍
actionable
Strategies
Trading Strategies
‍
Smart Stock Scanner
‍
FREE
RESOUrCES
Simple Backtest
Calculator
Simple Seasonality
Calculator
The Kelly Criterion
Calculator
Sentiment Geo Map
‍
Public Research Reports
‍
Free Webinar
COMPANY
‍
About
‍
Meet our Team
‍
In the News
‍
Testimonials
‍
Client Success Stories
Pricing
Bundle pricing
‍
Announcements
‍
FAQ
© 2024 Sundial Capital Research Inc. All rights reserved.
Setsail Marketing
TermsPrivacyAffiliate Program
Risk Disclosure: Futures and forex trading contains substantial risk and is not for every investor. An investor could potentially lose all or more than the initial investment. Risk capital is money that can be lost without jeopardizing ones’ financial security or life style. Only risk capital should be used for trading and only those with sufficient risk capital should consider trading. Past performance is not necessarily indicative of future results.

Hypothetical Performance Disclosure: Hypothetical performance results have many inherent limitations, some of which are described below. No representation is being made that any account will or is likely to achieve profits or losses similar to those shown; in fact, there are frequently sharp differences between hypothetical performance results and the actual results subsequently achieved by any particular trading program. One of the limitations of hypothetical performance results is that they are generally prepared with the benefit of hindsight. In addition, hypothetical trading does not involve financial risk, and no hypothetical trading record can completely account for the impact of financial risk of actual trading. for example, the ability to withstand losses or to adhere to a particular trading program in spite of trading losses are material points which can also adversely affect actual trading results. There are numerous other factors related to the markets in general or to the implementation of any specific trading program which cannot be fully accounted for in the preparation of hypothetical performance results and all which can adversely affect trading results.

Testimonial Disclosure: Testimonials appearing on this website may not be representative of other clients or customers and is not a guarantee of future performance or success.