
New Highs - And Junk Bonds - Break Out

There is a new high in 52-week highs, as junk bond yields have plunged.
A new high in highs
Almost exactly a year ago, we saw that nearly 40% of securities on the NYSE and Nasdaq exchanges had plunged to 52-week lows. In an about-face, last week more than a net 7% of securities on the NYSE and Nasdaq exchanges touched a 52-week high, the most in at least 6 months.
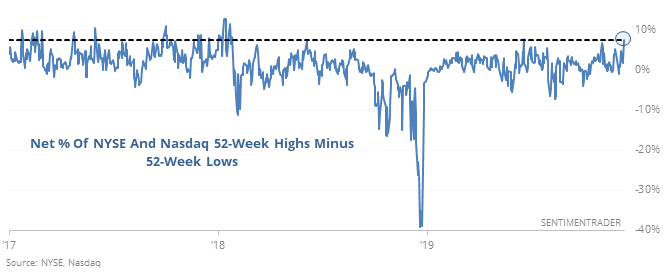
When breaking out along with the S&P 500, this led to modestly positive medium-term returns, but the last two instances didn’t amount to much for the bulls, as the S&P pulled back over the next 1-2 months both times. Mostly, this was a good longer-term signal. Over the next year, the S&P showed only a single loss.
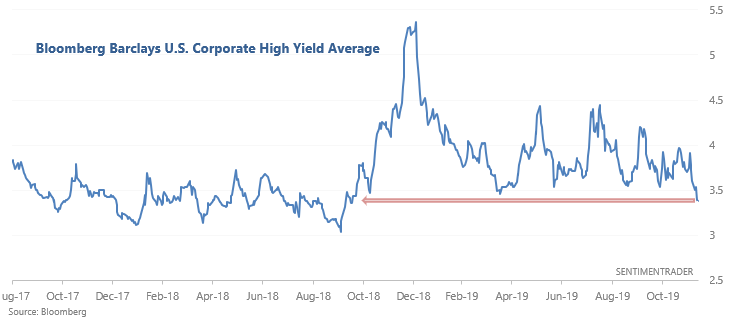
High yields
As Lisa Abramowicz mentioned on Twitter, junk bonds have rallied significantly over the past few months, pushing their yields to the lowest level in over a year. They're breaking out (or down) as stock indexes around the world do the same.
Since this figure usually trends higher before major periods of market and economic turbulence, cases in which this figure fell to a 1 year low were usually followed by stock market gains over the next 6-12 months, even though it often led to losses over the next 2 months.
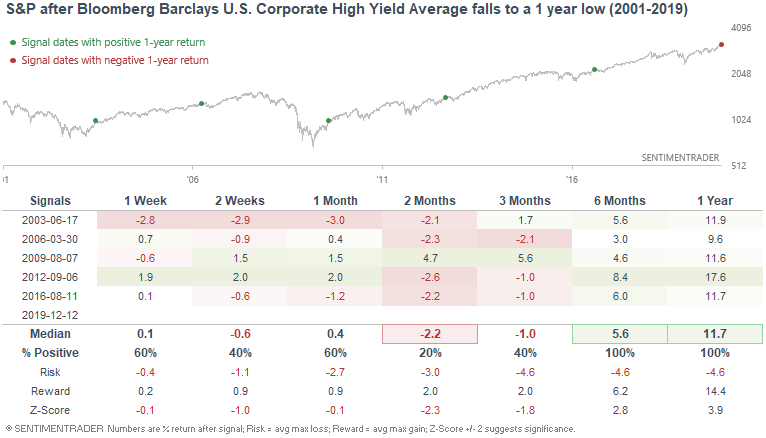
While traders would like to take this as an all-clear sign, it's worth noting those sketchy 2-3 month returns.
This is an abridged version of our recent reports and notes. For immediate access with no obligation, sign up for a 30-day free trial now.
We also looked at:
- Penny stock traders have left the market
- The percentage of NYSE securities with point-and-figure buy signals is the highest in a year
- What happens after the S&P has gone more than 2 months without a 1% move (the VIX is noteworthy)
- Our Stock/Bond Ratio hit a 1-year high
- The Relative Strength Index (RSI) on the Japanese Nikkei 225 is overbought for the 1st time in a year
- An update to our primary fundamental metrics