
New Features - S&P 1500 Screens, New indicators
Over the weekend, we rolled out some new features on the site (the announcements of "what's new" can always be found here).
S&P 1500 Stock Screens
For about the last year, the daily report has had a section that provided Long & Short ideas for the S&P 1500 stocks that we have on the site. This section of the report has been recreated as 'screens' on the site.
You can find the screens under Stocks -> Screens.
Defitions of these screens are:
To get a handle on which stocks are showing an unusual amount of optimism or pessimism, we can look at their current Optimism Index relative to their average over the past year. A stock showing extreme pessimism relative to its average will have a highly negative z-score. A stock with unusual optimism will have a highly positive z-score. As with all screens, this is only a starting point. Some of the stocks have a short history. Some are in the midst of merger talks. Some are on the cusp of a new long-term trend. Stocks shaded in gray were not on the prior day's list.See the November 15, 2015 report for more background on this screen.
You can view the screens at:
New indicators
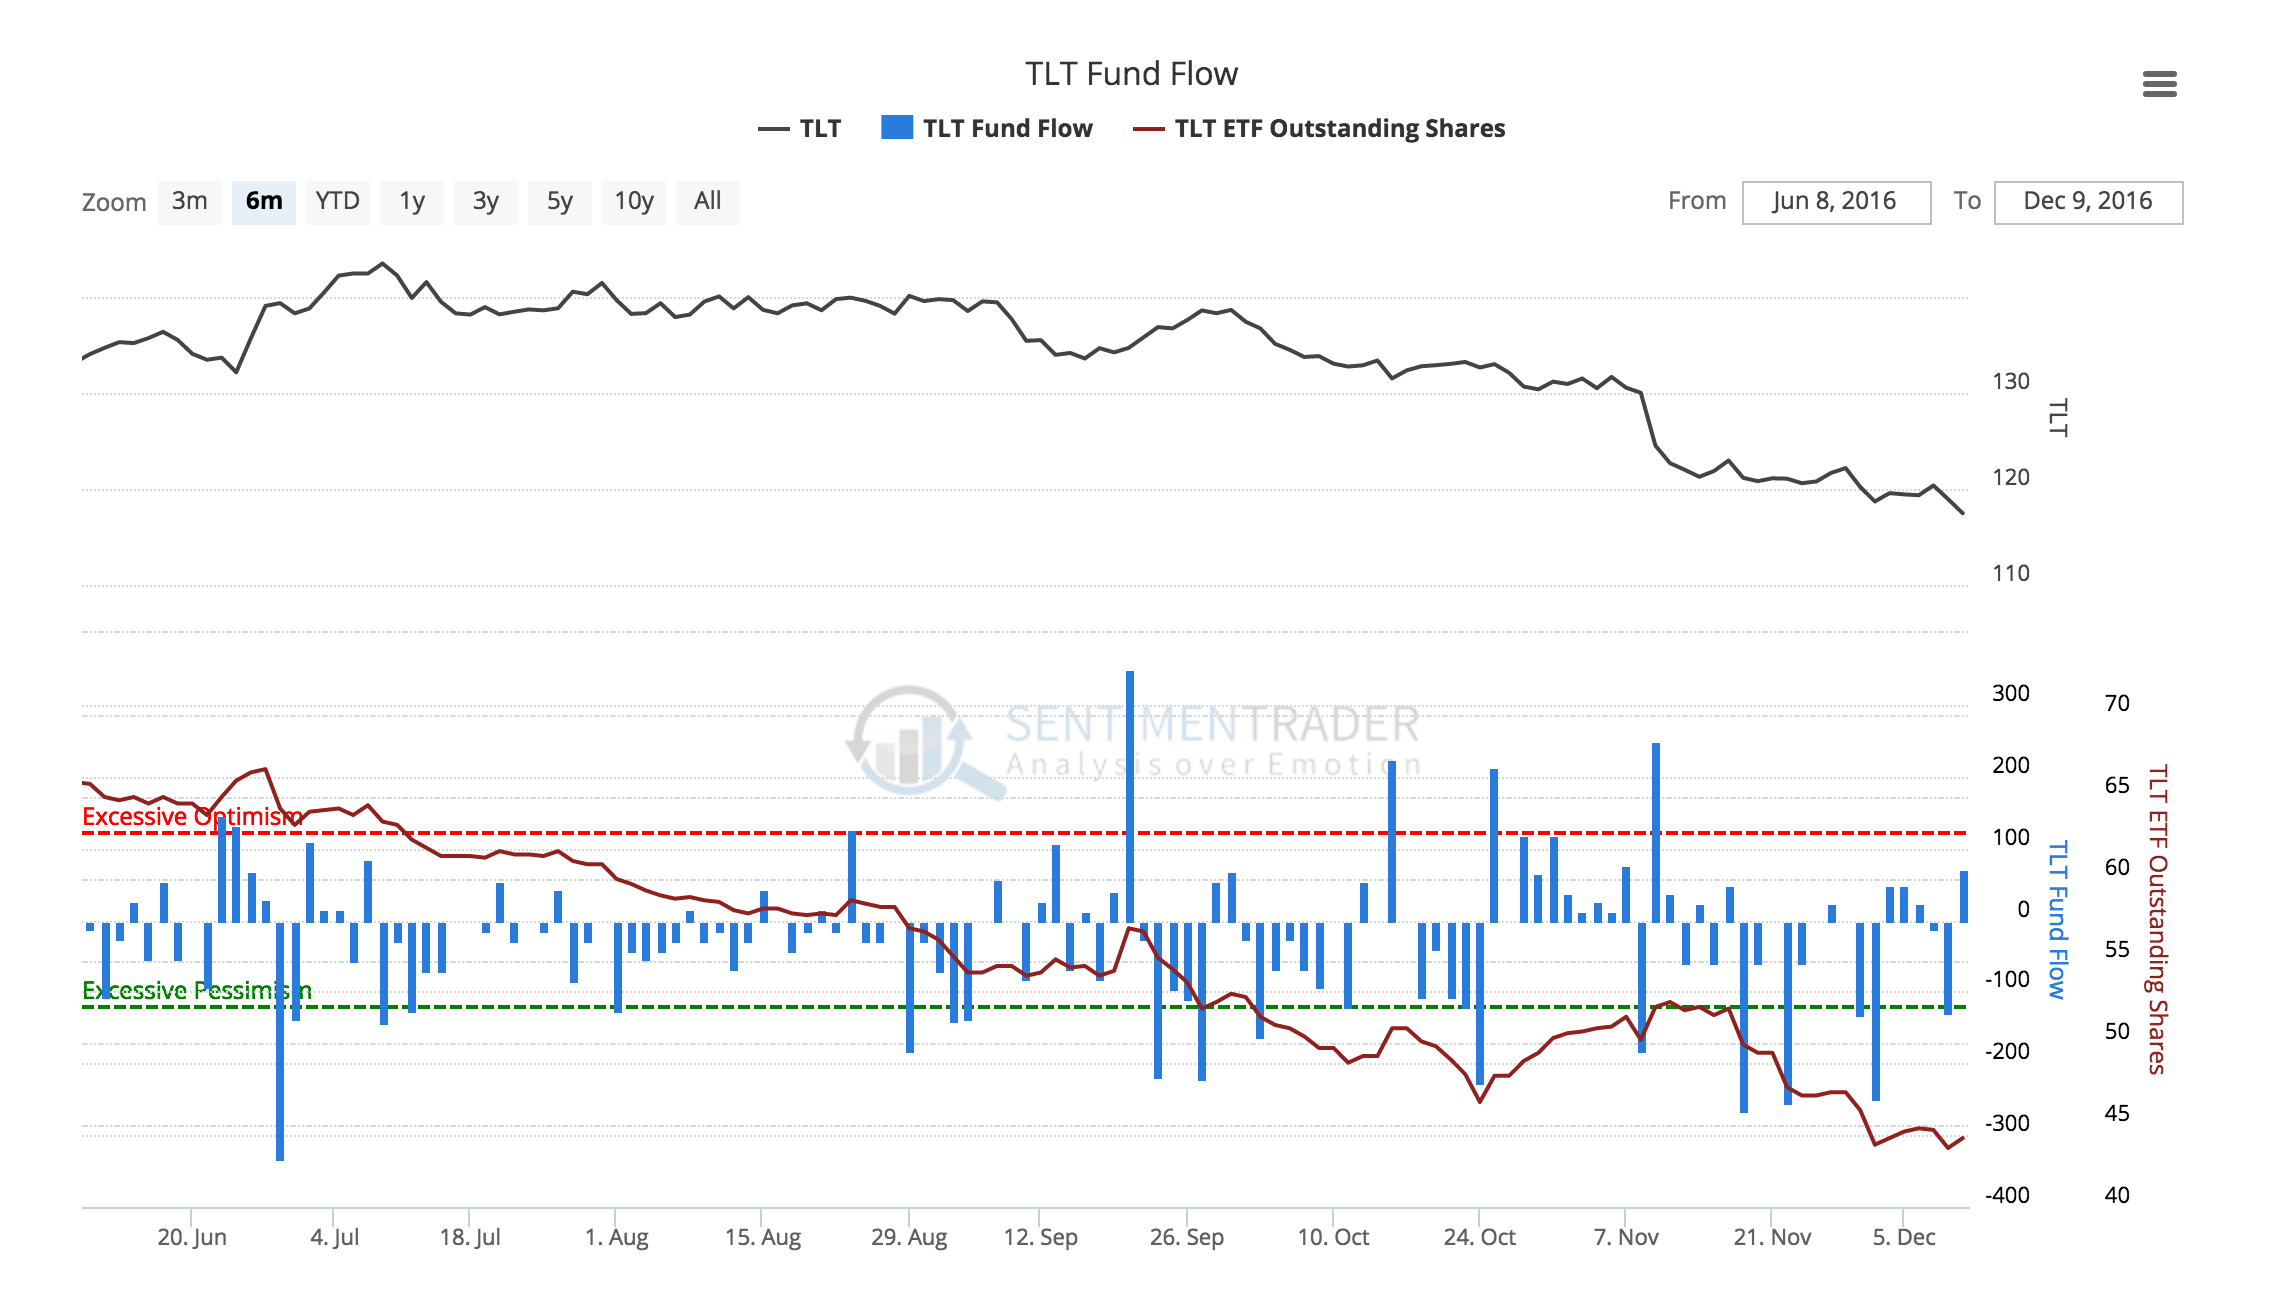
For the most active ETF's, we have added Shares Outstanding as an indicator. The description of this indicator is:
The shares outstanding shows, in millions, how many units have been created to meet demand from investors. The number of shares rise as demand increases and participants need to meet that demand by creating new units. It is extremely important to note, however, that "demand" does not necessarily mean "buying". If there is a lot of demand for shares from short sellers, then the number of shares could rise as well. So you can see the number of shares outstanding rise even as a fund falls and vice-versa. Usually, if there is a very sharp increase or decrease in the number of shares over a short time period, it's a sign of extreme short-term demand and is best used as a contrary indicator.
You can find a list of the Most Active ETF's Shares Outstanding here.
Additionally, you can add Shares Outstanding to fund flow charts as a secondary indicator. For example, if you are viewing the TLT Fund Flow chart, you can add the TLT Outstanding Shares indicator as a secondary indicator.
[caption id="attachment_1048" align="aligncenter" width="649"] Figure 1: TLT Fund Flow with Shares Oustanding[/caption]